1 Literature Overview
Occupational Accidents, Workplace Accidents, Accidents at work, Workplace injuries, Determinants, Factors, Cost, Occupational Safety, Occupational Risk, Commuting Accidents, Accident Frequency, Accident Severity
1.1 General background on occupational accidents
1.1.1 Introduction
Occupational accidents are a broad and complex field of study. They are tracked by various international organisations and extensively researched, with over 12,000 results in PubMed alone (2004 - 2024). However, comparing data across international and national organisations is challenging due to differing definitions and reporting standards. Similar issues arise in literature due to variations in definitions, outcome variables, and target populations. This section will first examine international and national reporting standards and provide a definition for an Occupational Accident (OA). The second section will explore factors related to the occurrence of these OAs, resulting in a conclusion.
1.1.2 Global, European, and Belgian context of an occupational accident
The International Labour Organization (ILO) (International Labour Organization, 2024a) defines an OA as “an unexpected and unplanned occurrence, including acts of violence, arising out of or in connection with work, which results in one or more workers incurring a personal injury, disease or death”. ILO is an United Nations agency that brings together governments, employers, and workers from 187 member states to address work-related topics such as employment creation, workers’ rights, social protection, and social dialogue (International Labour Organization, 2022). The ILO maintains a data-platform that provides statistics on labour themes, including employment, wages, health and safety and OAs (International Labour Organization, 2024b).
The European Commission also maintains a data-platform where information regarding OAs are stored from its member states (Eurostat, 2023b). In this context an OA is defined as: “An accident at work is defined in European Statistics on Accidents at Work (ESAW) methodology as a discrete occurrence during the course of work which leads to physical or mental harm. Fatal accidents at work are those that lead to the death of the victim within one year of the accident taking place. Non-fatal accidents at work are defined as those that cause at least four full calendar days of absence from work” (Eurostat, 2023b).
The definition, particularly the four-day reference, affects reported numbers. Additionally, Eurostat’s reports do not account for OAs that occur during commuting (travelling the distance between one’s home and place of work on a regular basis) (Eurostat, 2024). Both platforms use insurance records as data sources. For 2021, Eurostat reported 1,497 non-fatal OAs per 100,000 employed persons in Belgium (Eurostat, 2023b), while the ILO reported 2,314 (International Labour Organization, 2025).
In the Belgian context and legislation, OAs are described as incidents occurring during work or commuting, characterized by a sudden event with one or more external causes leading to an injury (including damage to prostheses). This accident must have a causal link to the injury and occur during and due to the performance of the employment contract (Federal Public Service Employement, Labour and Social Dialogue). In Belgium, insurance data from both private and public sectors is analysed by Federaal agentschap voor beroepsrisico’s (FEDRIS) and Medex respectively. FEDRIS provides this data to Eurostat (Federal Agency for Occupational Risks, 2023c), and since 2014, public data is also provided to Eurostat (Eurostat, 2023b).
Since our focus in the current project is the Belgian context, the definition from the Belgian legislation will be used. Data from FEDRIS and Medex will be used as reference points. This allows us to stay as close as possible to the source and minimize error from third-party adjustments.
As an illustration, the following paragraph illustrates a comparison between the number of non-fatal OAs reported by Eurostat (Eurostat, 2023c) and the numbers available from FEDRIS (Federal Agency for Occupational Risks, 2022) and Medex (Health, Food Chain Safety and Environment, 2023) for the year 2021. Eurostat reported 62,038 non-fatal OAs. FEDRIS reported 105,286 accepted workplace OAs, with 46% leading to over 3 days’ absence, totalling around 48,432 OAs. Medex reported approximately 26,154 accepted workplace OAs. However, the exact number and lost workdays are unclear due to different reporting categories. Based on Table 1.2, it is assumed that 50% of public sector OAs led to more than 3 workdays lost. This provides an estimation of 13,077 cases. Adding these estimates, we get 61,509, close to Eurostat’s reported number. The difference could be due to rounding and assumptions for the public sector.
1.1.3 Occurrence and severity of occupational accidents in Belgium
Occupational accidents can be quantified through different outcome values, as the number of OAs or the frequency and severity degree. The number of OAs can be measured in different ways, namely (1) in a given time period (e.g. yearly, quarterly, monthly,…), (2) in a normalized way (e.g. per 100,000 workers, per 1,000,000 worked hours,…), and (3) combination of both (e.g. per 100,000 workers per year).
As an example for the number of OAs on a yearly basis, we can illustrate the amount of OAs for 2022. The private sector reported 150,696 OAs, with 127,296 accepted by insurers, i.e. 84.5%. Of these, 103,570 occurred at work and 23,726 during commutes (Federal Agency for Occupational Risks, 2023a). The public sector reported 40,008 OAs, with 29,881 at work and 10,127 during commutes to insurers. Medex, overseeing the public sector, reported a 90.6% acceptance rate for all filed OAs, but didn’t provide a workplace versus commute breakdown (Health, Food Chain Safety and Environment, 2023). A previous paragraph illustrated an example of standardized reporting, such as Eurostat’s method.
The concepts of frequency and severity degree, including their calculation, are defined by Belgian legislation (codex over het welzijn op het werk) (Federal Agency for Occupational Risks, 2025). Companies are required to calculate these metrics annually for their reports.
In a given calendar year, the number of full-time employees per employer is calculated by dividing the sum of the number of all registered workers per day by 365 verklarende nota. This allows one to take account of staff turnover during that calendar year. Several rules apply to calculate this number:
- when an employee’s actual hourly schedule does not reach three-fourths of a full-time schedule, the number of calendar days on which he is registered in the personnel register, is divided by two;
- with regard to educational institutions, full-time employment in this context means the minimum number of teaching hours and/or equivalent hours for the relevant level of education (e.g. primary education, secondary education lower grade,…) to be performed by the employee;
- for individuals undergoing vocational training in which some form of employment is provided, for persons linked by an apprenticeship contract, for trainees and for students following a course of study whose training program provides for some form of work, the “number of employees” is calculated by the total number of hours during which they perform this form of work, divided by 1,750 (average exposure hours to the risk for a full-time employee). Applying this calculation, one arrives at a number of full-time equivalents. The sum of the three results gives the total “number of employees”.
Frequency is calculated as the total number of OAs divided by total risk exposure hours, multiplied by 1,000,000 for ease of use. For the number of OAs only workplace OAs are included (not OAs during commuting), and these OAs need to have at least one day of absence (not including the day of the OA itself). Total risk exposure hours are calculated by multiplying the amount of full time employees with 7.6 (daily working hours) and 229 (annual work days). More information (in Dutch) is available on the FEDRIS webpage on frequency and severity degrees.
Severity degree is categorized into two forms: the real severity degree and the global severity degree. The real severity degree is calculated as the amount of absence days (due to an OA, on the workplace) divided by the total risk exposure hours, multiplied by 1,000. The global severity degree is an adjusted form of the real severity degree. Should a fatal OA occur, then the real severity degree does not accurately reflects the loss of working days (e.g.: how many days of absence is a fatal OA). The global severity degree, follows the same formula as the real severity degree, with the adjustment that the amount of absences days are increased with a fixed amount of 75 days per percent of permanent disability, set by legislation.
1.1.4 Consequences of occupational accidents in Belgium
Next, we will explore the consequences of OAs, focusing on individual incapacity and financial costs.
In 2022, of the accepted OAs in the private sector, 42.2% did not result in incapacity, 47.2% caused temporary incapacity, 10.6% caused lasting incapacity and 0.1% were lethal (Federal Agency for Occupational Risks, 2023a). For lasting incapacity, a percentage indicates the individual impact.
In the public sector, an exact breakdown similar to the private sector is not available. However, relevant data is provided in Table 1.1 and Table 1.2.
| Degree | Workplace | Commutes |
|---|---|---|
| No | 42.2% | 42.0% |
| Temporary | 47.7% | 44.7% |
| Lasting | 10.1% | 13.3% |
| 1-4.5% | 5.3% | 5.8% |
| 5-9.5% | 3.6% | 5.4% |
| 10-15.5% | 0.9% | 1.6% |
| >16% | 0.3% | 0.4% |
| Lethal | 0.1% | 0.1% |
| Degree | Workplace | Commutes |
|---|---|---|
| No or | ||
| temporary | 84.7% | 78.5% |
| Lasting | 15.3% | 22.5% |
| 1-4.5% | 13.3% | 18.0% |
| 5-9.5% | 1.7% | 3.4% |
| >10% | ||
| or lethal | 0.3% | 1.1% |
| Duration | Workplace | Commutes |
|---|---|---|
| 0 Days | 43.6% | 44.0% |
| 1-3 Days | 11.0% | 12.8% |
| 4-30 Days | 30.7% | 26.8% |
| 1-3 Months | 10.1% | 11.2% |
| > 3 Months | 4.6% | 5.2% |
| Duration | Total |
|---|---|
| 0 Days | 35.7% |
| 1-29 Days | 45.0% |
| 1-6 Months | 15.3% |
| 7-12 Months | 2.7% |
| >12 Months | 1.3% |
The private sector report does not detail financial impacts. However, the public sector report shows 70,729 payment requests in 2022, with 82.3% approved. The average cost was €371 for workplace OAs and €562 for commuting OAs, totaling nearly €10 million paid to health insurance, victims or healthcare providers (Health, Food Chain Safety and Environment, 2023). If these figures are extrapolated to the private sector, the estimated cost could be around €50 million.
1.1.5 Conclusion
The numbers above illustrate that OAs remain an important issue in Belgium. Some of these impacts have severe consequences, affecting not only the injured individuals but also causing financial and economical repercussions. Investigating the antecedents and finding ways to mitigate the occurrence of OAs can reduce, or even eliminate these effects.
Literature shows that total costs of occupational accidents for the public sector alone rose to about €10 million in 2022. If similar patterns hold in the private sector, the total cost could exceed €50 million, highlighting the need for better prevention strategies to protect workers and reduce economic losses.
1.2 Outcomes of occupational accidents
Many different outcomes can be chosen depending on the research question. Commonly used outcomes are the number of OAs and (normalised) OA rates (measures of occurrence), OA seriousness, days away from work and (direct) costs (measures of severity). In the following paragraphs, we describe a selection of outcomes that will be used throughout the present study.
1.2.1 Selected outcomes for occurrence
Log-binomial and negative binomial regression models are widely used to estimate the probability that an individual employee reports an OA, including both workplace and commuting incidents. These models allow for robust risk estimation and can incorporate personal, job, and exposure variables, supporting both research and practical safety management (Alhainen et al., 2021; Ropponen et al., 2023). The following three individual binary outcomes were selected.
1.2.1.1 Reported occupational accident (individual-level)
An individual-level binary variable (0/1) indicating whether an employee reported an OA (workplace or commuting) in a given month, in a given year, regardless of insurer acceptance.
1.2.1.2 Commuting occupational accident (individual-level)
An individual-level binary variable (0/1) indicating whether an employee experienced an insurer-accepted commuting OA in a given month, in a given year.
1.2.1.3 Workplace occupational accident (individual-level)
An individual-level binary variable (0/1) indicating whether an employee experienced an insurer-accepted workplace OA in a given month, in a given year.
1.2.1.4 Frequency degree (company-level)
A company-level continuous variable reflecting a normalised number of selected workplace OAs. A Belgian example is the frequency degree (see Section 1.1.3). Internationally, the Total Recordable Incident Rate (TRIR) is commonly used. TRIR is calculated by dividing the total number of recordable incidents by the total number of hours worked, and multiplying the result by 200,000. This multiplier standardizes the rate per 100 full-time employees working 40 hours per week for 50 weeks per year, facilitating comparison across organisations and industries (Amanda Edens, 2016).
1.2.2 Selected outcomes for severity
The following outcomes are all linked to the severity of (workplace) OAs. Obviously, a workplace OA can only be judged on its severity after having occurred in the first place. Consequently, the following measures can only represent us subset of cases (events) where the first three described outcomes from the previous paragraph capture all cases (as well events as non-events). The following three individual outcomes were selected.
1.2.2.1 Serious workplace occupational accident (individual-level)
An individual-level binary variable (0/1) indicating whether an employee experienced a serious (or non-serious) insurer-accepted workplace OA in a given month, in a given year.
Several studies have developed predictive models to classify OA severity into binary categories such as serious/not serious or fatal/non-fatal. Frequently used methods include logistic regression, support vector machines (SVM) and other techniques (Recal & Demirel, 2021).
In our study, such a binary variable would be useful to explore if certain determinants exist to distinghuish between (very) severe and normal workplace OAs as defined by Belgian law (see Figure 2.1).
1.2.2.2 Duration of absence due to a workplace occupational accident (individual-level)
An individual-level count variable conceiving the total number of absence days resulting from a workplace OA.
An example in which such a variable is used can be found in a recent study predicting days of absence after overexertion injuries among cleaners (González Fuentes et al., 2022).
1.2.2.3 Direct wage cost due to a workplace occupational accident (individual-level)
An individual-level continuous variable representing the direct wage cost associated with a workplace OA.
Somewhat analogous to the previous variable, this variable uses the direct wage cost linked to the number of days absent from work. There is strong evidence from multiple countries that workplace OAs cause significant, measurable direct wage losses at the individual level, with robust modelling approaches used to estimate these costs (Boden & Galizzi, 1999).
1.2.2.4 Severity degree (company-level)
A company-level continuous variable reflecting a normalised absence measure due to selected workplace OAs. A Belgian example is the severity degree (see Section 1.1.3). The metric reflects the organisational impact of OA severity. Internationally, various indicators are used to capture this impact, such as the Days Away, Restricted or Transferred (DART) and Lost Time Injury Frequency Rate (LTIFR). While these metrics are not directly equivalent to the severity degree, they serve as proxies for assessing the broader consequences of OA severity. An example in which such a variable is used can be found in a recent study identifying risk factors and predicting future injury trends, employing machine learning and statistical models to analyse days away, restricted, or transferred due to OAs (Yedla et al., 2020).
1.2.3 On the validity of company-level metrics
Metrics such as the TRIR, LTIFR, Lost Time Incident Rate (LTIR) and related indicators are commonly used to assess the frequency and severity of OAs because of their advantages. However, these measures have also been subject to substantial critique, particularly regarding their statistical robustness.
TRIR-like measures are practical for standardization and benchmarking. Such measures provide a common metric for comparing safety performance across companies, industries, and time periods, supporting benchmarking and regulatory compliance. The metric is straightforward to calculate and communicate, making it accessible for management, workers, and external stakeholders. Moreover, regular tracking can encourage organisations to focus on reducing OAs and improve safety awareness (Pilskog Orvik et al., 2024; Sarkheil, 2021).
However, TRIR-like measures show disadvantages too. The metric treats all “recordable” incidents equally, regardless of severity, failing to distinguish between minor and major injuries. The metric is sensitive to random short-term fluctuations and may not reflect underlying safety trends, leading to misinterpretation and potentially uninformed management decisions. Organisations may under-report incidents or focus on reducing minor injuries to improve their metric, rather than addressing root causes of (serious) OAs and since TRIR-like measures are per definition lagging indicators, they do not predict future incidents or measure proactive safety efforts, such as near-miss reporting or hazard controls (Backlund et al., 2024; Dekker & Tooma, 2022; Pilskog Orvik et al., 2024).
TRIR-like measures, such as the frequency degree, do not capture severity or context. They are statistical insensitive and undergo random fluctuations. The metric is vulnerable for manipulation and has only limited predictive value. As a consequence, the measure should be used cautiously and in conjunction with other safety performance indicators to provide a more comprehensive view of workplace safety.
Moreover, these indicators are sensitive to variations in company size. As early as 1994, researchers highlighted that metrics like LTIFR can be disproportionately affected by single incidents in small organisations (Positive Performance Indicators for OHS Beyond Lost Time Injuries, 1994). For example, one OA in a small company with relatively few working hours can result in a significantly inflated rate compared to a larger company with a higher total number of hours worked.
Recent research has questioned the predictive validity of the TRIR, suggesting that it is largely random and lacks meaningful interpretability (Hallowell et al., 2021). The authors argue that reporting TRIR with decimal precision is misleading, as the metric does not offer sufficient statistical reliability to justify such granularity. The authors illustrate this with an example: to be reasonably confident that the TRIR falls within a narrow range, e.g., between 0.95 and 1.05 per 200,000 working hours, a company would need to accumulate approximately 300 million hours of work. This requirement far exceeds the operational scale of most organisations. Another illustration provided by the authors involves a company with five recordable injuries over 1,000,000 hours worked. In this case, the statistically accurate representation of TRIR would be a range between 0.43 and 2.34, rather than a single point estimate. These examples underscore that, for the vast majority of companies, TRIR does not offer reliable or actionable insights. By extension, frequency-based metrics used in Belgium are subject to similar statistical limitations.
For company-level OA measures, like the frequency and severity degrees explored in the present study, more insights from international scientific literature can be gathered when examining their international equivalents (like TRIR, LTIFR, Injury Severity Rate (ISR), Lost Workday Rate (LWDR) and others) safety metrics.
| Measure | Definition (Belgium) | International equivalent examples |
|---|---|---|
| Frequency degree | workplace OAs per 1,000,000 hours worked | TRIR, LTIFR (per 200,000 hours) |
| Severity degree | lost days due to workplace OAs per 1,000 hours worked | ISR, LWDR (per 200,000 hours) |
1.3 Determinants of occupational accidents
1.3.1 Introduction
This section, in first instance based on the structure of the Khanzode et al. (2012) meta-analysis, categorizes antecedants of OAs into individual, job-related, organisational, sector and, temporal levels.
1.3.2 Individual factors
1.3.2.1 Age
The relationship between age and occupational workplace OAs is complex, with most studies reporting a positive relationship (Kaur et al., 2023; Vallmuur et al., 2016). Notably, these studies focus on workplace OAs that involve slipping or falling. A study found OA rates were high among late teens, decreased in early twenties, then increased again from late forties and remained high into the sixties (Takahashi & Miura, 2016). Another study found that young workers have higher rates of OAs when involving exposure to harmful substances or contact with objects (Kaur et al., 2023). A common trend is that while younger workers experience more OAs, older workers suffer more severe consequences from such OAs (Salminen, 2004; Yong Jeong, 1999).
Age is also a significant factor influencing the risk and severity of occupational commuting OAs. Older workers, especially women, are at higher risk for commuting OAs, while younger workers may be more prone to workplace OAs. The relationship between age and OA risk is complex and varies by OA type and severity.
Multiple studies indicate that older workers, particularly those aged 45–65, have a higher incidence of commuting OAs compared to younger workers. Older women are especially at risk for commuting OAs, while older men are more likely to be involved in work-related traffic OAs during work hours (Delgado-Fernández et al., 2022; Nenonen, 2011; Salminen, 2000). Older individuals (especially those over 55) are more likely to experience severe or fatal commuting OAs, while younger individuals are more likely to have less severe (light) crashes (Delgado-Fernández et al., 2022). Younger workers tend to experience more non-fatal injuries, while older workers are at higher risk for severe or fatal outcomes (Delgado-Fernández et al., 2022; Peng & Chan, 2019).
These findings highlight the need for age-specific safety management and preventive measures to address the varying risks associated with different age demographics in the workforce.
1.3.2.2 Biological sex
Men consistently experience more occupational workplace OAs and fatalities than women. This difference is observed across various countries and industries, and is especially pronounced for fatal OAs. Men experience workplace fatality rates over nine times higher than women in the US over a 25-year period (Hendricks et al., 2024). In Brazil, men were found to be 6.2 times more likely to have a serious OA than women (Neves & Fonseca, 2023). Men also have higher rates of non-fatal workplace injuries, with US data showing rates 1.4 times higher for men than women (Hendricks et al., 2024). In Brazil, the prevalence of OAs was 47% lower among women compared to men (Feijó et al., 2018).
Research indicates that men tend to have higher rates of occupational workplace injury claims than women (Berecki-Gisolf et al., 2015; Rommel et al., 2016). This disparity can be attributed to variations in occupational groups (Berecki-Gisolf et al., 2015). There is an indicative link between gender and the severity of OAs. A study found that a higher amount of sick days due to work-related injuries are reported for women than for men (Fontaneda et al., 2019).
Biological sex of the victim does also seem to influence the chance of experiencing an occupational commuting OA. Women are at a higher risk of commuting OAs, compared to men. This difference is consistent across multiple countries and types of commuting injuries. Studies from Spain and Italy show that women have significantly higher rates of commuting OAs than men, both for traffic-related and non-vehicle (walking) incidents (Craig et al., 2023; López et al., 2017; Salerno & Giliberti, 2019, 2021).
Women are more frequently injured while commuting to work, particularly in the morning, and during winter months (Craig et al., 2023; López et al., 2017; Salerno & Giliberti, 2021). Sectors such as transport, public administration, health, and retail show higher rates of commuting injuries among women and women injured in commuting OAs tend to be older than men (Craig et al., 2023; Salerno & Giliberti, 2019).
The evidence suggests a need for preventive measures that are sensitive to these gender differences to effectively address and mitigate occupational risks for all workers.
1.3.2.3 Work experience
Generally, the relation between work experience and OAs is complex and is studied in several ways. Consequently, findings are not always consistent. Work experience can be measured in various ways, including job-specific experience, seniority within a company, and overall career experience. Additionally, age plays a complex role in this dynamic. As workers grow older, they may face a range of challenges—such as reduced mobility, strength, dexterity, balance, hearing and vision impairment, and cognitive changes leading to slower reactions—all of which can increase their vulnerability to workplace OAs (Kowalski-Trakofler et al., 2005).
This complicates the research of the impact of work experience on the incidence and severity of OAs. Work experience brings several benefits, such as familiarity with the work environment, the ability to handle complex problems, and compensatory skills to overcome job demands (Ilmarinen, 2001; Laflamme & Menckel, 1995).
Regarding the incidence of OAs, most studies indicate a correlation between lower job experience and a higher likelihood of workplace injuries. For example, Jeong et al. (2021) found that occupational injuries are more common among employees with less than a year of experience, emphasizing the importance of job training. This proportion is even higher among employees over 60 who have less than a year of job-specific experience (Jeong, 2021). Conversely, a study based on self-reported data found that employees with over 40 years of experience are more likely to experience OAs (Monteiro Ferreira et al., 2020). Overall, a significant portion of studies suggests that employees with less job experience are at greater risk of workplace OAs (Breslin, 2006; Morassaei et al., 2012), indicating a potential link between OAs and work experience.
Regarding the severity of OAs, research findings have been inconsistent. Yedla et al. [-yedla2020] identified job experience as a key factor in predicting injury outcomes—specifically, the severity of injuries—while other studies, such as those by Margolis et al. [-MARGOLIS2010417], did not find sufficient evidence to support this claim. It is important to note that most researchers agree older workers experience fewer OAs. However, when OAs do occur, they tend to result in more severe injuries (Salminen, 2004; Yong Jeong, 1999).
1.3.2.4 Nationality
In a globalizing world with rising migration, more and more companies are employing foreign workers. In 2023, 79.3% of the active workforce in Belgium were from Belgium, 8.8% from other EU Member States and 11.5 from third countries. In Europe, these resident foreigners represent approximately 17% of the workforce (EURopean Employment Services, 2025).
This raises safety and health concerns in the workplace. Previous research suggests that foreign workers are disproportionately represented in the most dangerous jobs and often assigned the most hazardous tasks within those roles (Porru & Baldo, 2022).
A systematic review and meta-analysis, including more than 12.000 migrant workers employed in 13 countries, found that workplace OAs and injuries are relatively common among international migrant workers, with a pooled prevalence of at least one injury or OA at 22% (Hargreaves et al., 2019).
Moreover, authors highlight that migrants are, on average, involved in OAs at least twice as often as nationals (Salminen, 2011).
Since foreign or immigrant workers are more likely to be employed in physically demanding and hazardous jobs, the higher risks also lead to greater severity (e.g. more fatalities) of OAs compared to native workers (Moyce & Schenker, 2017).
Research from Spain, Italy and Denmark, demonstrate that foreign workers have an increased risk of (both non-fatal and fatal) occupational injuries compared to the native workers (Ahonen, 2006; Ahonen & Benavides, 2016; Guerreschi et al., 2024). As far as we know, there are no specific papers on the relationship between migrant workers and commuting OAs. However, Alruwaili et al. (2024) note that migrant workers are more frequently involved in car OAs than native-born workers. It remains unclear whether these OAs occur among workers for whom driving is part of their job.
Besides the fact that immigrant workers are often exposed to more risks, language difficulties can also play a role. Language problems create a communication barrier that can lead to confusion, and misunderstanding, a common problem among immigrant workers (Lavy et al., 2010).
Previous research has demonstrated that 66% of workplace injuries among speakers of a foreign language can be attributed to lack of safety training at the language or comprehension level of the worker (Demirkesen & Arditi, 2015).
Data from FEDRIS show that in 2023, 20% of fatal OAs involved foreign workers. Additionally, the incidence of workplace OAs among foreign workers from both the EU and non-EU countries has been rising between 2012 and 2022. Specifically, there was an increase of 5.5% for EU foreign workers and 8% for non-EU foreign workers between 2021 and 2022 Federal Agency for Occupational Risks (2023a).
1.3.2.5 Salary level
Research reveals mixed results. A recent study found that a higher wage level was associated with lower work OA rates (Cabrera-Flores, 2023). Lalive et al. (2006) on the other hand, found a strong positive correlation between wages and the risk of workplace OAs. The authors propose two opposing theories: one suggests that individuals in riskier workplaces earn higher wages (e.g. as risk premiums). The other theory posits that those with higher earning potential opt for less risky jobs. These theories aim to explain the observed contradictions in workplace risk and earnings.
1.3.2.6 Residential location
A study conducted in Illinois identified spatial disparities in the incidence of OAs, revealing that certain ZIP codes exhibited a disproportionately high number of cases per 1,000 employed individuals. Specifically, ten spatial clusters accounted for 36% of all reported OAs, despite comprising only approximately 23% of the state’s population and 25% of its workforce. These findings suggest that residential location may be associated with elevated OA risk. The authors propose that certain neighborhoods may be disproportionately affected by OAs and emphasize the need for community-targeted prevention strategies (Forst et al., 2015).
Employees residing in small towns or isolated rural areas tend to experience slightly longer durations of compensated time off work following OAs compared to those living in suburban areas (Lane et al., 2021). This suggests a modest association between residential location and the severity of OAs. However, the study emphasizes that while these regional effects are statistically significant, they are relatively small in magnitude when compared to other confounders such as age, and injury type.
1.3.2.7 Commuting distance
A study among hospital employees found that greater commuting distance was significantly associated with an increased risk of occupational commuting OAs. The risk of a commuting OA increases as the distance between home and work grows. For example, compared to commutes under 3.6 km, the risk is over twice as high for distances between 3.6 and 9 km, about 2.6 times higher for distances between 9 and 19 km and more than four times higher for commutes over 19 km (Ponsin et al., 2020). Employees also perceived longer commutes as contributing to a heightened risk of occupational commuting OAs (Fadzil & Bulgiba, 2023). The mode of commuting also plays a role. Commuting by bicycle or on foot is associated with a higher risk of OAs compared to driving. However, these active modes offer notable health benefits, including fewer sickness absences and improved work ability (Finnish Institute of Occupational Health, 2025). No studies were identified that demonstrate a clear relationship between commuting distance and the severity of OAs.
1.3.2.8 Use of personal protective equipment
The use of Personal Protective Equipment (PPE) is a significant factor in preventing OAs. PPE is designed to safeguard workers from various hazards in the workplace. Its effectiveness in preventing workplace OAs and injuries is a critical area of research, especially in high-risk environments such as healthcare and industrial settings.
PPE is essential for protecting healthcare workers from infection by pathogens through exposure to body fluids and respiratory droplets, with studies emphasizing the importance of proper use and removal to prevent contamination (Honda & Iwata, 2016).
The physical barrier provided by PPE is crucial in preventing the transmission of microorganisms and protecting against serious workplace injuries or illnesses among health care providers (Lakshmi et al., 2018).
In the context of logging work, personal protectors have been reported to prevent injuries, with safety boots being particularly effective; however, the behaviour of workers may change when protectors are used, which can influence the overall OA rate (Klen & Väyrynen, 1984).
Proper use of PPE has a significant impact on reducing occupational illnesses and OAs, as evidenced by an assessment that highlighted the protective benefits of PPE against various health and safety issues in businesses (Çolak et al., 2017).
In conclusion, the use of PPE is a critical factor in preventing workplace OAs and injuries. Proper usage, compliance, and advancements in PPE technology, such as smart PPE, contribute to its effectiveness in creating safer work environments across various industries.
Despite the recognized importance of PPE in mitigating OAs, we could not find targeted research examining the specific relationship between PPE usage and the severity of OAs.
1.3.2.9 Health problems
Some papers have reported an association between certain chronic health problems and increased risk for OA and injury. For instance, there are a number of reports that examines the relation (Girard et al., 2009; Sprince et al., 2002; Viljoen et al., 2006; Zwerling, 1997) between hearing impairment and risk for occupational injuries, yielding inconclusive findings. A review (Palmer et al., 2008) found moderate positive associations between impaired hearing, neurotic illness, diabetes, epilepsy and use of sedating medication and occupational injury, but warns that there were major gaps in the evidence base. They found little evidence that impairments of vision increase risks of occupational injury. Further, no evidence was found on psychotic illness. For diabetes, epilepsy and cardiovascular disease there was Palmer et al. (2008) only limited evidence or even conflicting results. There is some research examining the relation between alcohol abuse and risk for OAs, mainly revealing a positive relationship. (Ajith et al., 2022; Tecco et al., 2013). Further, a review (Pollack & Cheskin, 2007) found that the risk of injury for obese versus non-obese employees overall was slightly increased, although many of the estimates were not statistically significant. The literature suggests only indicative relationships between OAs and health problems.
1.3.2.10 Sleeping disorders
A study found a significant association between sleeping disorders and OAs. Those with sleeping disorders are more likely to experience falls and incidents involving moving objects. Furthermore, the study indicates that the more severe the sleeping disorder, the higher the likelihood of OAs (Chau et al., 2002). A study on fatal OAs identified a relationship between disturbed sleep and these OAs. Those who reported experiencing disturbed sleep in the previous two weeks had a significant association with fatal workplace OAs (Åkerstedt et al., 2002).
1.3.2.11 Substance abuse
Research indicates a relation between opioid use and increased OAs among commercial vehicle drivers (Howard et al., 2004). A similar association is observed in young male workers using illicit substances, like cocaine and marijuana (Kaestner & Grossman, 1998). The findings highlight the need for workplace policies and educational interventions to concerning substance use (Dinis-Oliveira & Magalhães, 2020).
A study on cannabis use found that individuals with confirmed positive tests had significantly more workdays lost due to OAs than non-users, indicating a positive association between substance use and OA severity (Khashaba et al., 2017).
1.3.2.12 Personality traits
Individuals with lower degrees of agreeableness and conscientiousness have a higher likelihood of OAs (Beus et al., 2015; Clarke & T. Robertson, 2005; Osca & López-Araújo, 2020). Individuals with a higher degree of extraversion and neuroticism have a higher likelihood of OAs (Beus et al., 2015). It was found that agreeableness accounted for the largest proportion of explained variance in OAs (Beus et al., 2015).
The role of personality traits varies depending on the setting of the OA. In the context of workplace OAs, low agreeableness and high neuroticism are significant factors. For traffic OAs, high extraversion, low conscientiousness, and low agreeableness are more important (Clarke & T. Robertson, 2005).
A study also found that gender and job control interact with personality in relation to OAs. Specifically, women who score high in neuroticism tend to have higher likelihood of OAs, but only when their job control is low (Osca & López-Araújo, 2020).
The direct link between personality traits and the severity of occupational injuries is less clear, as most studies emphasize OA involvement rather than injury severity.
1.3.2.13 Number of years of schooling
Research indicates that the number of schooling years is negatively related to the likelihood of experiencing OAs. More years of education are related to a lower degree OAs (Barreto et al., 1997). Another study investigated the effects of receiving occupational safety and health training during formal schooling. Participants who received this training were found to be half as likely to have an OA (Boini et al., 2017).
The direct link between numbers of year of schooling and the severity of occupational injuries is less clear, as most studies emphasize OA involvement rather than injury severity.
1.3.5 Sectoral differences
Sectors which are considered as high-risk for fatal OAs are construction, transportation and storage, manufacturing and agriculture, forestry and fishing. In a European context, such information can be found in actual Eurostat Accidents at work statistics. Also in a recent report by Eurostat (2023a), it was shown that employees working in construction had the highest incident rate concerning work OAs, with transport and storage and administrative and support service activities coming in second and third respectively. The lowest incident rate was reported for the sector public administration and defense. Another study reported no significant differences between employees from the industry and agriculture sectors and employees from the services industry concerning risk of work OAs than employees (Alali et al., 2016).
According to Abdalla et al. (2017), agriculture, forestry, fishing, construction, manufacturing and transportation account for approximately half of the serious OAs at work and the highest proportion of fatal OAs.
Also in terms of financial consequences, sectoral differences seem to play an important role. Multiple studies have ranked industries by the average cost per worker for occupational injuries. Transportation-related sectors—such as taxicabs and trucking consistently appear at the top of these lists for both total costs and cost per worker, indicating higher direct wage costs from OAs compared to most other industries. In contrast, sectors like legal services and financial services are at the bottom, with much lower costs per worker (Leigh et al., 2004). Cited contributing factors include higher OA risks (Leigh et al., 2004), higher direct wage cost per OA (Miller, 1997) and compensations (higher wages for increased risks) (Strawiński & Celińska-Kopczyńska, 2019).
In Europe, the Nomenclature générale des Activités économiques dans les Communautés Européennes of Europese activiteitennomenclatuur (NACE) system is used to classify economic activities. Its hierarchical structure enables detailed categorization and analysis across various sectors. In Belgium, the national version known as Belgian version of the the Europese activiteitennomenclatuur (NACE) (NACE-BEL) is applied. Alongside the NACE-BEL system, the Paritair Comité (joint collective agreement or sectoral committee) (PC) classification is also used. This system is based on collective labour agreements and assigns companies and their employees to specific joint committees. More information on this classification can be found on the website of the Federal Public Service Employment, Labour and Social Dialogue (FPS ELSD). A review of international scientific literature did not yield any insights into the impact of the PC classification on companies or their employees.
1.3.6 Temporal patterns
Occupational accidents may display a number of temporal patterns. Insight in these temporal patterns and understanding the underlying mechanisms can contribute to the unraveling of the complex interplay between the risk factors and the occurrence and the severity of the OA. It is therefore an essential element for effective prevention and safety measures in the workplace. Several types of temporal patterns can derived from research. Patterns related to the weather conditions, day, week, seasonal and year patterns can be distinguished. These temporal patterns may be explained by several mechanisms, reflecting the combination of ‘individual human’ factors (such as fatigue, concentration loss, performance level..) and external factors (associated to the job related exposure to several risks, such as the shift system, physical environment, exposure to heat or cold,…).
1.3.6.1 Time trend (years)
Occupational accident rates seem to be decreasing globally and in many countries. For severity measures, the image is less clear. Multiple large-scale, recent studies show consistent downward trends in frequencies of OAs, especially for fatal injuries (Lundstrom et al., 2023a; Takala et al., 2023) although some countries or sectors show stable or increasing rates, often due to reporting improvements or other evolutions.
1.3.6.2 Time of the year (months)
Some findings of research exploring the seasonality of OAs throughout the year seems to report more OAs in winter (Health, Food Chain Safety and Environment, 2023; Jankovský et al., 2019), while other authors report higher rates in summer (Lundstrom et al., 2023b; Ogiński et al., 2000). This may be related to weather conditions (and temperature), but also to seasonal peaks in production or higher proportion of temporary workers.
In this context, also the the annual transition to daylight saving time and winter time is noteworthy.
1.3.6.3 Time of the week (days)
Occupational accidents are less frequent on Wednesday and Friday, while they occur more often on Monday and Tuesday (Health, Food Chain Safety and Environment, 2023; Jankovský et al., 2019) In this context, the Monday effect is worth mentioning: a higher OA risk on Monday mornings compared to other working days (Elfering et al., 2020). Several explanations are possible: work-related cognitive failure and sleep-onset latency on the previous night, lower mood an higher fatigue, the perception of social stressors,…
Another finding is that there are fewer injuries during weekends (Health, Food Chain Safety and Environment, 2023; Ogiński et al., 2000).
1.3.6.4 Time of the day (hours)
Research on the relationship between the time of day and workplace OAs has yielded several insights into how temporal factors can influence safety in the work environment.
First, in their report on OAs in the public sector, Medex refers to the VIAS 2020 report on commuting OAs for the conclusion that OAs are more frequent in the morning and evening due to the traffic jams. The number of OAs in Belgium -to the greatest extent in the education sector- seems to be lower during school holidays (Health, Food Chain Safety and Environment, 2023). Other research also found more OAs in the morning hours, tending to peak around noon (Jankovský et al., 2019; Wigglesworth, 2006; Wojtczak-Jaroszowa & Jarosz, 1987).
Most workplace OAs occur late in the morning and mid- to late afternoon, with a notable increase in severity during the afternoon hours. Fatigue, long shifts, and irregular work schedules further elevate the risk during these times. Employers should pay special attention to these periods to enhance workplace safety.
Fatal workplace OAs are most common in the late morning or early afternoon, but when adjusted for the number of workers at work, the proportion of fatal OAs at night is more than double that during the day(Williamson & Feyer, 1995). So, more severe OAs tend to occur at night (Ogiński et al., 2000).
In conclusion, the evidence suggests a clear relationship between the time of day and workplace OAs. There is a consistent pattern of increased OA risk associated with late morning to midday and night shifts. Additionally, the risk of OAs is influenced by both internal and external factors, with fatigue playing a significant role. These findings highlight the importance of considering time-related factors when developing strategies to improve workplace safety.
1.3.6.5 Weather
Weather conditions influence the likelihood of OAs (Health, Food Chain Safety and Environment, 2023; Roberts, 2004). High temperature increase risk (Otte im Kampe et al., 2016), especially over consecutive hot days (Gariazzo et al., 2023; McInnes et al., 2018). The amount of rainfall (precipitation) also raises this risk (Tian et al., 2023). Winter weather conditions, such as snowfall, are associated with a higher risk (Hayashi et al., 2023) and commuting OAs (Davis & Rohlman, 2021). It is important to note that these relationships can vary across different sectors. Implementing flexible starting times or telework can mitigate weather-related risk for some roles.
1.3.6.6 Holidays & vacations
In their publication on OA in the public sector in Belgium, Medex report less OAs during school holidays (Health, Food Chain Safety and Environment, 2023).
This may be due to the sample, which is partly consisting of teachers, but also less traffic during holiday periods may be an explanation.
There is insufficient information available in the scientific literature to come to a clear conclusion on an increase or decrease during holidays. For example: popular explanations for a possible increase include: higher workload or work pressure for those who remain at work; temporary and thus less experienced workers on the work floor; and more distractions during holidays.
1.3.6.7 Summer- and wintertime changes
The transition to Daylight Saving Time, which results in the loss of one hour of sleep, has been associated with an increase in workplace injuries and injuries of greater severity on the Monday following the change. Conversely, the switch back to Standard Time does not show significant differences in sleep, injury quantity, or injury severity (Barnes & Wagner, 2009).
1.3.6.8 Coronavirus Disease 2019 (COVID-19) pandemic
While direct data on traditional workplace OAs (e.g., physical injuries) during COVID-19 is limited, previous economic crises have shown that recessions often lead to a decrease in reported OAs, partly due to reduced workforce size and a shift toward more experienced or permanent workers (Fuente et al., 2014).
The pandemic also accelerated remote work and digital health solutions, which likely reduced certain types of workplace OAs but introduced new psychosocial risks (Tan et al., 2024).
1.3.6.9 Terrorist attacks
No studies directly link terrorist attacks to a rise in the global frequency of OAs. While a Belgian study on OAs among public servant personnel -compared to an overal mean of 130 OAs per weekday- very specifically notices a much higher number of 387 workplace OAs March 22 2016 (the day of the terroristic attacks in Brussels Maalbeek Metro Station and Zaventem National Airport) (Federal Public Service Health, Food Chain Safety and Environment, 2022), no research directly examines whether the overal number of OAs changed as a result of these Brussels terrorist attacks. The available studies focus on related topics such as disaster victim identification, the immediate health impacts on victims, and the psychological effects on emergency personnel, but do not analyze trends in OA rates before or after the attack Wesemann et al. (2020).
1.3.7 Summary Overview Determinants
Table 1.3 summarizes the various determinants related to the occurrence and severity of OAs. For each determinant is indicated whether the relationship with occurrence/severity is clear (multiple studies established a relationship) or indicative (some studies found relationships, but they are not well understood, replicated, or are based on very select samples).
| Factor type | Variable | Link with occurrence | Link with severity |
|---|---|---|---|
| Individual | Age | Clear | Clear |
| Biological sex | Clear | Indicative | |
| Work-experience | Indicative | Indicative | |
| Nationality | Clear | Clear | |
| Salary level | Indicative | Indicative | |
| Residential location | Indicative | Indicative | |
| Commuting distance | Clear | Indicative | |
| Use of PPE | Clear | Indicative | |
| Health problems | Indicative | Indicative | |
| Sleeping disorders | Clear | Clear | |
| Substance abuse | Clear | Clear | |
| Personality | Clear | Clear | |
| Numbers of years schooling | Clear | Indicative | |
| Job related | Workforce segment | Clear | Clear |
| Contract type | Clear | Indicative | |
| Nature of contract | Indicative | Indicative | |
| Shifts or long hours | Clear | Indicative | |
| Hazards in work system | Clear | Clear | |
| Organisational | Work location | Clear | Indicative |
| Company size | Indicative | Clear | |
| Psychosocial risk factors | |||
| Work stress/pressure | Indicative | Indicative | |
| Job satisfaction | Indicative | Indicative | |
| Social relationships | Indicative | Indicative | |
| Safety climate and culture | Indicative | Indicative | |
| Insurance | |||
| Investment in prevention | Clear | Indicative | |
| Sectoral | NACE code | Clear | Clear |
| Temporal | Time trend | Clear | Indicative |
| Time of the year | Indicative | Indicative | |
| Time of the week | Clear | Clear | |
| Time of the day | Clear | Indicative | |
| Weather | Clear | Clear | |
| Holidays | Indicative | Indicative | |
| Corona crisis | Indicative | Indicative | |
| Terrorist attacs | Indicative | Indicative |
1.3.8 Conclusion
The synthesis of research indicates that besides temporal variations and sectoral differences, the individual, job-related, and organisation related factors play significant roles in the occurrence of OAs. However, organisational factors, appear to have a more substantial indirect influence by shaping job conditions and individual behaviours. Job-related factors directly impact OA rates through the nature of the work and associated risks. Individual factors, while important, often interact with job and organisational contexts to influence OA outcomes. Therefore, a comprehensive approach addressing all three types of factors is essential for effective OA prevention strategies.
- Research shows that sectoral differences and temporal patterns significantly influence the occurrence and severity of occupational accidents. While these factors should be taken into account, they are not always directly actionable in employer-targeted prevention strategies.
- Individual, job-related, and organisational factors all play important roles in occupational accident outcomes. Organisational factors tend to exert a more substantial indirect influence by shaping job conditions and individual behaviours. Job-related factors have a direct impact due to the nature of the work and its associated risks. Individual factors often interact with both job and organisational contexts, further influencing accident outcomes. These factors are, in some cases, more suitable for targeted intervention in employer-focused prevention strategies.
1.4 Identifying and addressing knowledge gaps on occupational accidents
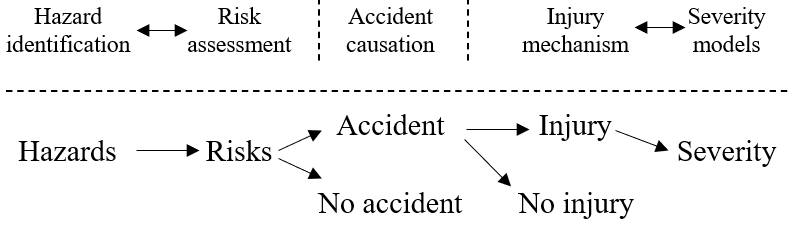
Khanzode et al. (2012) point out two key gaps in OA literature. They refer to a framework that outlines a sequence of events in OAs: hazards lead to risks, which may result in an OA. An OA may or may not cause an injury, and if an injury occurs, its severity is assessed (Figure 1.1).
The authors note that while the relationship between hazard identification and risk assessment is well-studied, a gap in literature exists in understanding why some risks lead to OAs and others do not. This first gap arises from studies using small, sector-specific datasets to evaluate OA odds (e.g. Hansen et al., 2022; Hinkka et al., 2013). These datasets focus on specific variables, limiting our understanding of why some risks cause OAs and others do not, including the interplay of these variables. Generalizability decreases when data only includes individuals who have experienced OAs.
While numerous models exist to explain the severity of injuries when they occur, a second gap exists in understanding why some OAs result in injuries while others do not. This second gap, like the first, is affected by the limitations of the datasets and also by the uniformity of available data (e.g. differences in outcome variables across datasets). It should be noted that OAs (and injuries) cannot be attributed to a single factor, but are the result of a complex interplay of different contributing factors, which are often not taken into account in former research.
The authors suggest that insights in how risks lead to OAs and subsequent injuries, considering multiple contributing factors, can enhance the understanding and development of interventions, especially for high-frequency and low-severity OAs.
A potential solution is to use a large, structured dataset with diverse variables. This dataset should include individuals across various occupations, both those who have and have not experienced OAs. This allows for a comprehensive assessment of factors contributing to OAs. Additionally, structured data on leave days (0 - …) due to OAs can help to identify why some OAs lead to injuries and others do not.
- Liantis Payroll Services (PS) has knowledge on absence days and wage loss for employees experiencing occupational accidents as well as on all other (risk-)exposed employees without accidents through wage codes
- Liantis External Service for Prevention and Protection at work (EDPB in Dutch) (ESPP) has knowledge on details of insurer notified occupational accidents via automated data fluxes
- Liantis Risk Solutions (RS) has knowledge on contracts and fee payments to cover occupational accident risks for a limited number of occupational accident insurers
List Of Acronyms
- COVID-19
- Coronavirus Disease 2019
- DART
- Days Away, Restricted or Transferred
- ESAW
- European Statistics on Accidents at Work
- ESPP
- External Service for Prevention and Protection at work (EDPB in Dutch)
- FEDRIS
- Federaal agentschap voor beroepsrisico’s
- FPS ELSD
- Federal Public Service Employment, Labour and Social Dialogue
- ILO
- International Labour Organization
- ISR
- Injury Severity Rate
- LTIFR
- Lost Time Injury Frequency Rate
- LTIR
- Lost Time Incident Rate
- LWDR
- Lost Workday Rate
- NACE
- Nomenclature générale des Activités économiques dans les Communautés Européennes of Europese activiteitennomenclatuur
- NACE-BEL
- Belgian version of the the Europese activiteitennomenclatuur (NACE)
- OA
- Occupational Accident
- PC
- Paritair Comité (joint collective agreement or sectoral committee)
- PPE
- Personal Protective Equipment
- PS
- Payroll Services
- RS
- Risk Solutions
- RSI
- Repetitive Strain Injury
- TRIR
- Total Recordable Incident Rate