| CODELIST | XNR | XMLTAG |
|---|---|---|
| INSZ | 1 | ssin |
| NRACCF | 2 | oafAccidentFileNumber |
| DCREAT | 3 | accidentFileCreationDate |
| CDRSSIMPL | 5 | simplifiedDeclaration |
| DATONG | 7 | date |
| HEUREACC | 8 | hour |
| CWEG | 9 | onWayToWork |
| CLIEUACC | 10 | placeCategory |
| CPAYSACC | 11 | countryCode |
| CPOSTACC | 13 | postalCode |
| NA | 14 | streetName |
| NA | 17 | workSiteNumber |
| LOCLES06 | 18 | injuredBodyPart |
| NATLES06 | 19 | natureOfInjury |
| DEVIATION | 20 | deviation |
| CAGMAT | 21 | materialAgent |
| CONTOCCBL | 22 | injuryContactCategory |
| TYPETRAV | 23 | workCategory |
| TYPEPOSTTRAVAIL | 24 | workPostCategory |
| PROFHABENT | 25 | usualWorkActivity |
| CANCV | 26 | seniorityUsualProfessionCode |
| HRNORDEBACC | 27 | startHour |
| HRPAUSDEB | 28 | beginLunch |
| HRPAUSFIN | 29 | endLunch |
| HRNORFINACC | 30 | endHour |
| Consequenceaccident | 31 | incapacityCategory |
| NBRJITPREV | 32 | nbDaysTemporaryUnavailability |
| CGRAV | 33 | accidentSeriousness |
| NRASSBCSS | 34 | insuranceCompanyNumber |
| NRACC | 35 | caseNumber |
| NA | 36 | policyNumber |
| DRECEPASS | 37 | declarationDate |
| CATPROFVICT | 39 | professionalCategory |
| CITP08 | 40 | functionCode |
| CDURCONTR | 41 | limitedDurationContract |
| NATCONTR | 42 | fullTimeEmployment |
| CONSS | 43 | subjectionToNssoCategory |
| SOUSTRAIT | 44 | subcontracting |
| CPAYSETABL | 45 | countryCode |
| CPOSTETABL | 46 | postalCode |
| NRBCEEMPL | 48 | enterpriseNumber |
| NACEPRINCEMPL08 | 51 | naceCode |
| CTAILLEEMPL | 52 | numberOfEmployeesCategory |
| NA | 53 | countryCode |
| NA | 55 | postalCode |
| NA | 56 | streetName |
| NA | 58 | businessUnitNumber |
2 Data Quality Report
Keywords
Occupational Accidents, Workplace Accidents, Accidents at work, Workplace injuries, Determinants, Factors, Cost, Occupational Safety, Occupational Risk, Commuting Accidents, Accident Frequency, Accident Severity
2.1 On the stakeholder landscape of occupational accident data
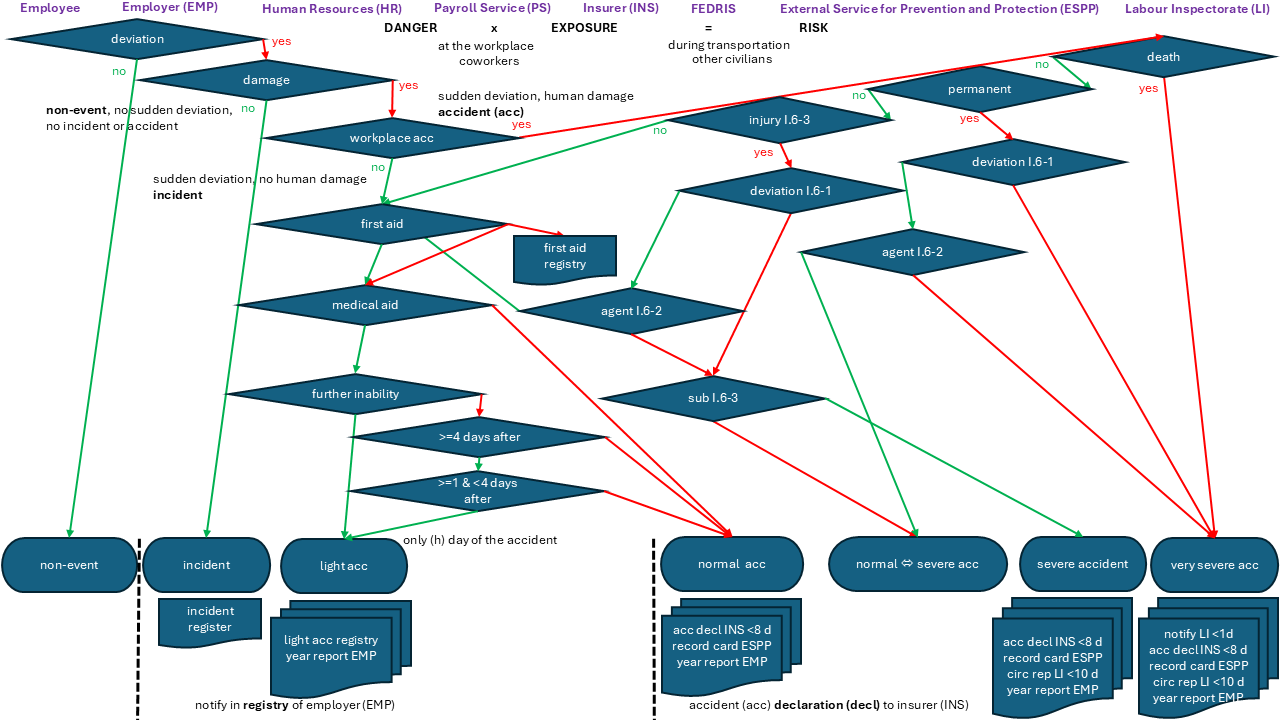
An Occupational Accident (OA) occurs when a sudden deviation leads to human damage during work or on the way to work. When there are no sudden deviations (non-events), or sudden deviations without damage (incidents, almost-accidents), we do not speak about an OA. Whenever an OA occurs (during commuting or at the workplace), a series of events is set in motion to ensure that the accident is properly documented, reported, and managed. This process involves multiple stakeholders, each with specific roles and responsibilities. Let’s take a closer look at the sequence of events that typically follows an OA.
Employee: After experiencing an OA and getting any first aid (or further aid, or both if needed), the employee immediately communicates the accident details, makes reference to witnesses (if any, these are important for the insurance claims) and (afterwards) provides medical attests and reports (if any, to document medical costs) to the representatives of his/her employer. Whenever possible, the employee provides all the necessary basic information to make sure the employer is able to fill out an OA declaration form for the insurance company (if needed). Figure 2.1 helps in deciding on the seriousness of an OA as well as on the need to report what to whom.
Employer: The employer (together with his Human Resources (HR) and/or payroll department and/or prevention advisor) prepares an official OA declaration form (if needed), fills out the accident record card for the external service for prevention and protection (ESPP) at work (if needed, the accident declaration form may serve as accident record card), and compiles any internal reports (e.g. an entry in the first aid registry when first aid was provided at the workfloor, an entry in the register of light accidents if no wage loss nor medical costs were linked to the accident,…). If needed (whenever a medical doctor intervened and/or other medical costs were made), the accident declaration form should be submitted to the insurance company within 8 calender days (every Belgian employer is obliged to have an OA insurance), sometimes also to the External Service for Prevention and Protection at work (EDPB in Dutch) (ESPP), and, in the case of serious OAs, also to the Labour Inspectorate (LI). Several possibilities exist to submit the declaration. The National Social Security Office (NSSO) e.g. provides the aangifte sociale risico’s (ASR) application to determine the seriousness. The employer seeks advice (from internal and/or external prevention advisors) to decide on the seriousness of an OA happening at the workplace: serious workplace accidents should be reported by the employer through a circumstantial report (for C- and D componies cooperation with an ESPP is mandatory) to the LI. The LI has to be notified immediately if an employee deceases or experiences permanent damage (a very serious workplace OA) and should receive the circumstantial report within 10 calender days in case of a serious workplace OA. More details are shown in Figure 2.1.
HR Department: The HR department updates the employee’s personnel file and communicates with both the employee and the insurance company. They also inform the payroll department about any necessary changes to replace the employee’s usual salary codes with salary codes specifically linked to the OA (e.g. any absence from work the day of the accident, one to four days after the accident, first and second week after the accident, first month after the accident, more than one month after the accident,…).
Payroll Department: Payroll handles the salary administration and records any leave and/or wage loss related to the accident. This can be done by the employer self or through Payroll Services (PS) from an officially recognised social secretariat. Payroll shares this information with the HR department of the employer, who shares it on his turn with the insurance company. In this way the direct costs of the accident for the employer can be calculated, and the insurance company can calculate the compensation when appropriate.
Roles of Liantis
- Insurance Company: an officially recognised insurance company covering Risk Solutions (RS) for OAs, receives the accident declaration forms and assigns them to an insurance dossier with a unique insurance dossier number (although in some cases, multiple insurance dossier numbers for a same OA may occur). The insurance processes the claims covering the medical costs and other possible financial compensations like wage loss. They share (parts of) the the dossier with the employer and with FEDRIS, the Belgian Federal agency for occupational Risks, the institute that originated from the Fonds voor Arbeidsongevallen (old Dutch name of FEDRIS before the fusion with FBZ, FAT in French) (FAO) (responsible for OAs before the fusion) and Fonds voor Beroepsziekten (old Dutch name of FEDRIS before the fusion with FAO, FMP in French) (FBZ) (responsible for occupational diseases before the fusion). The insurance company has to decide on rejection or acceptance of the dossier, and in case of acceptance, to calculate the financial compensation. Using the information from the dossiers of each employer, an insurance company can learn which employers have a higher risk for OAs and act accordingly. The insurance company also has a role in the prevention of OAs, by providing advice to the employer on how to prevent future accidents. Herefore, they can use their own insights, or information from Federaal agentschap voor beroepsrisico’s (FEDRIS) like e.g. the list of companies with an aggravated risk for OAs.
Roles of Liantis
FEDRIS: FEDRIS processes all claims shared through the recognised OA insurance companies. Next to the insurance dossier number, FEDRIS assigns its own unique FEDRIS record number to the claim and shares parts of the original accident declaration files with the LI and the ESPP of the employer (of the employee experiencing the OA). In some cases, multiple FEDRIS record numbers for a same OA or a same insurance dossier may occur). In the record flow, a unique identifier for the employer (the Crossroads Bank for Enterprises (KBO in Dutch) (CBE) number from the Crossroads Bank for Enterprises) and the employee (the national Identificatienummer Sociale Zekerheid (rijksregisternummer of BIS-registernummer) (INSZ) number from the national registry and NSSO) is used in the communication with the different ESPP. This is done through a structured communication protocol with the ESPP, involving different stakeholders such as Crossroads Bank for Social Security (KSZ in Dutch) (CBSS) or Kruispuntbank Sociale Zekerheid (CBSS in English) (KSZ) Kruispuntbank Sociale Zekerheid (KSZ) and CO-PREV. Each year, FEDRIS publishes statistical reports on the number of OAs in Belgium, frequency and severity degrees,… and provides the ESPP and insurance companies with lists of employers with aggravated risks and other company related statistics (number of full time equivalents, company, Belgian version of the the Europese activiteitennomenclatuur (NACE) (NACE-BEL) 2008 level 4 and whole private sector risk indices,…).
External Service for Prevention and Protection at work: The ESPP gets contacted by its customers directly (shortly or a longer time after the occurrence of an OA, if needed) and/or trough the automated FEDRIS dataflow. Using their knowledge of the customer (size of the company, education level of the internal prevention adviser, time spent for the customer in prevention activities,…), the external service assists in conducting or conducts an OA analysis and proposes preventive measures and services to avoid future OAs in the company. The investigation of the OA and/or the filing of a circumstantial report by an advisor of the ESPP is obliged for all C- and D companies whenever an OA was serious and/or led to a work leave of \(\geq\) 4 days (larger companies, A and B employers, usually investigate all accidents themselves). The ESPP report their findings to the employer, and when necessary, to the LI. The ESPP discuss their findings physically whenever they visit the employer the first time again after the occurrence of an OA.
Roles of Liantis
- Liantis ESPP receives -through FEDRIS and KSZ- parts of all accident declaration notifications coupled to workers employed by one of its customers
- Liantis ESPP decides -through its own algorithms- after receiving a notification on the seriousness of an occupational accident (see Section 2.9)
- Liantis ESPP decides -through its own business processes after receiving a notification- on the necessary tasks of the Liantis (prevention) advisors to assist the customers experiencing (serious) occupational accidents
- Liantis ESPP receives indications for absences >4 weeks (possibly due to occupational accidents) for workers employed by one of their customers
- Labour Inspectorate: In cases of serious accidents, the Labour Inspectorate (LI) investigates the incident and ensures compliance with safety regulations. They work closely together with the employer and the ESPP.
In Figure 2.1 below, we summarize a number of steps on how to decide which actions should follow an OA happening at the workplace or on the way to work. Occupational accidents classifying into the right side of the scheme (normal to very severe) should always be reported to the insurance company using an OA declaration form. Parts of these declarations will be structurally available to the ESPP. Incidents and light accidents (left side of the scheme) will not be reported to an insurance company. The consequence is that these data are not structurally available to the ESPP through the automated FEDRIS Federaal Actieplan voor de Reductie van Arbeidsongevallen (FARAO)-batch flow.
2.2 A general overview on the employers covered in the different source datasets
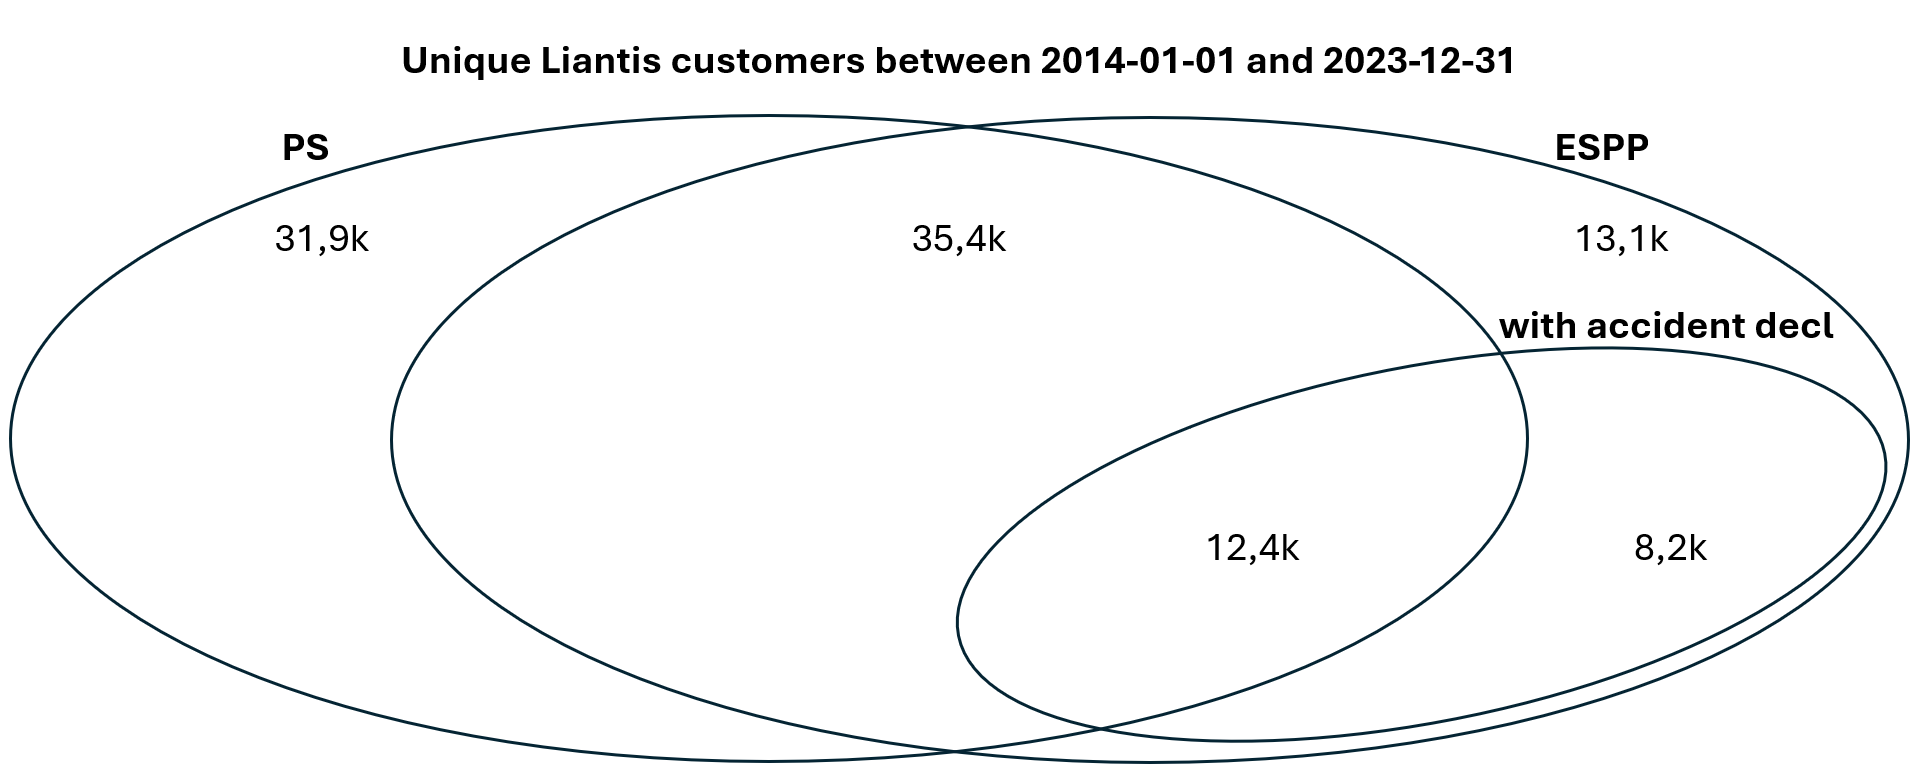
We started with creating a general overview of the customers of Liantis between 2014 and 2023. On the one hand, Liantis ESPP delivered prevention related prestations for 69,157 unique employers (identified by their CBE number) and on the other hand and in the same period, Liantis PS calculated wages for 79,723 unique employers (identified by their CBE number). Some 47,820 unique employers (identified by their CBE number) were mutual Liantis ESPP/PS customers. An even smaller group of 11,658 unique employers (identified by their CBE number) were mutual Liantis ESPP/PS/RS customers.
Via FEDRIS, Liantis ESPP received 293,938 accident declarations (concerning 161,696 employees, identified by their INSZ number), originating from 20,636 unique employers (identified by their CBE number). Some 90,619 declarations (~1/3) came from 12,407 unique employers (identified by their CBE number) being mutual Liantis ESPP/PS customers (concerning 52,240 employees, identified by their INSZ number).
- For investigations on the occurrence of an OA, accident declarations from the mutual customers of Liantis ESPP/PS should be considered and placed into perspective to the whole of mutual customers (also the ones without any OAs)
- For investigations of the severity of an OA, accident declarations can be considered from the workers who experienced an OA (>161k workers)
2.3 Liantis customer data preparation and preprocessing
2.3.1 Liantis ESPP customers
All timeregistrations of all Liantis ESPP colleagues between 2013 and 2024 were extracted from the database. We filtered the registrations between 2014-01-01 and 2023-12-31 that could be tied to Liantis ESPP unique employer numbers.
Time registrations for 69701 unique Liantis ESPP customer numbers were found in the dataset.
Liantis ESPP customer numbers are not unique for CBE numbers or vice versa. The same CBE number can be tied to multiple Liantis ESPP numbers and a big employer with several locations can have one and the same Liantis ESPP number for all locations, but the locations can have their own CBE number.
Time registrations for 69157 unique Liantis ESPP CBE numbers were found in the dataset.
2.3.2 Liantis PS customers
Lists of Liantis PS customers between 2014 and 2023 were exported in csv format by using an operational reporting tool.
For Liantis PS, 82564 unique customers by office and dossier combination and 79723 unique customers by enterprise identification number within CBE (crbnr) were found in the dataset.
Summary Liantis PS customers
During the study period 2014-2023, unique Liantis PS customers with wage calculations could be identified as follows:
2.3.3 Liantis RS customers
The list of 47820 mutual PS and ESPP customers was provided to Liantis RS with the request to indicate which customers were also customers of Liantis RS for an OA risk insurance and which were not. Results were only available for the period 2016-2024 and provided in Excel files.
For Liantis RS, 11658 unique customers by crbnr shared with Liantis ESPP and PS were found in the dataset (2016-2023).
2.3.4 Conclusions data preparation and preprocessing
Unambiguously identifying unique and mutual customers of Liantis ESPP and Liantis PS (and Liantis RS) in a historical period of ten years (2014 to 2023) proved to be time-consuming and challenging. The process ultimately led us to the following datasets for further use:
- Liantis ESPP timeregistrations of Liantis (prevention) advisors per customer (employers by CBE number)
- Liantis ESPP (and mutual PS) customers (employers by CBE number) with montly wage calculations
- Liantis PS (and mutual ESPP) customers (employers by CBE number)
- Liantis RS (and mutual ESPP and PS) customers (employers by CBE number)
During the study period 2014-2023, unique Liantis customers could be identified as follows (based on the different CBE numbers in the dataset):
- 69157: unique Liantis ESPP customers
- 79723: unique Liantis PS customers
- 47820: unique mutual Liantis ESPP and PS customers
- 11658: unique mutual Liantis ESPP, PS and RS customers
Since the number of mutual Liantis ESPP, PS and RS customers is only 1/4 of the mutual Liantis ESPP and PS customers, we will focus on the mutual Liantis ESPP and PS customers in the current study to maximize the use of available data.
2.4 FEDRIS notification records preparation and preprocessing
On the condition that Dimona exchanges occur for employees from an employer who is Liantis ESPP customer, Liantis ESPP can receive notifications of OAs declarations from FEDRIS through KSZ for this employer. Eligible declarations for all employers and employees and can be received in batch on a daily basis via Secure File Transfer Protocol (SFTP) in XML format. Liantis runs a batch process (‘FARAO-batch’, called after the FARAO Federal Action plan for the Reduction of Occupational Accidents) that that stores the raw Extensible Markup Language (XML)s in the database and processes the individual declarations for each victim per case. Next to the storage and mapping of the raw XMLs, the process creates an OA record in the Liantis ESPP database and runs a severity assessment.
- if serious:
- if not serious:
- creates a task
- a prevention advisor or company visitor executes the task and registers the task and its outcomes (including time registration on the Liantis ESPP customer number)
Parsing of the original FARAO-XML batches to retrieve the most important fields from source proved to be time consuming and difficult, certainly when the occupationalAccidentNotificationLot technical documentation with the necessary XML Scheme Definitions (XML Scheme Defenition (XSD)) were hard to find, their structural update unclear (2013? 2017?) and the KSZ documentation with the corresponding variables and labels incomplete and/or ambiguous in certain cases.
Data Quality Alert: mind the character encoding of the XML files
The processing of the original FARAO-XML batches trough the different Liantis ICT platforms (storing raw FARAO-XML in an oracle database and reading these raw XML files into a statistic programming language like R) generated a lot of parsing errors. The encoding of the characterset settings in the different platforms needed to be adjusted to get the correct and desired human readable information from the raw XML files. In R, we set an .Renviron file with the content NLS_LANG="AMERICAN_AMERICA.AL32UTF8" and for the database connection we specified the encoding encoding = "WE8MSWIN1252".
The raw XML files of all received batches were extracted from a local XML batch archive for the development phase of the FARAO-batch process (2013-02-26 to 2013-10-01) and from the Liantis ESPP database from the start of the FARAO-batch process on (2013-10-02 to 2024-12-11). The parsed sourcedata was stored in the R object Fedris.
Of course, it is extremely important to understand what the variables mean and to which labels the values of the variables in the XML source data (XNR is the number of the variable, XML tag the name of the variable) correspond. Herefore, the KSZ documentation was consulted where available and the link to the documentation (CODELIST is the name of the variable in the occupationalAccidentNotificationLot technical documentation was stored in the summary Table 2.2 displayed below. The order and name of the variables after parsing is stored in the variables PNR and PARSEDFIELD (not shown).
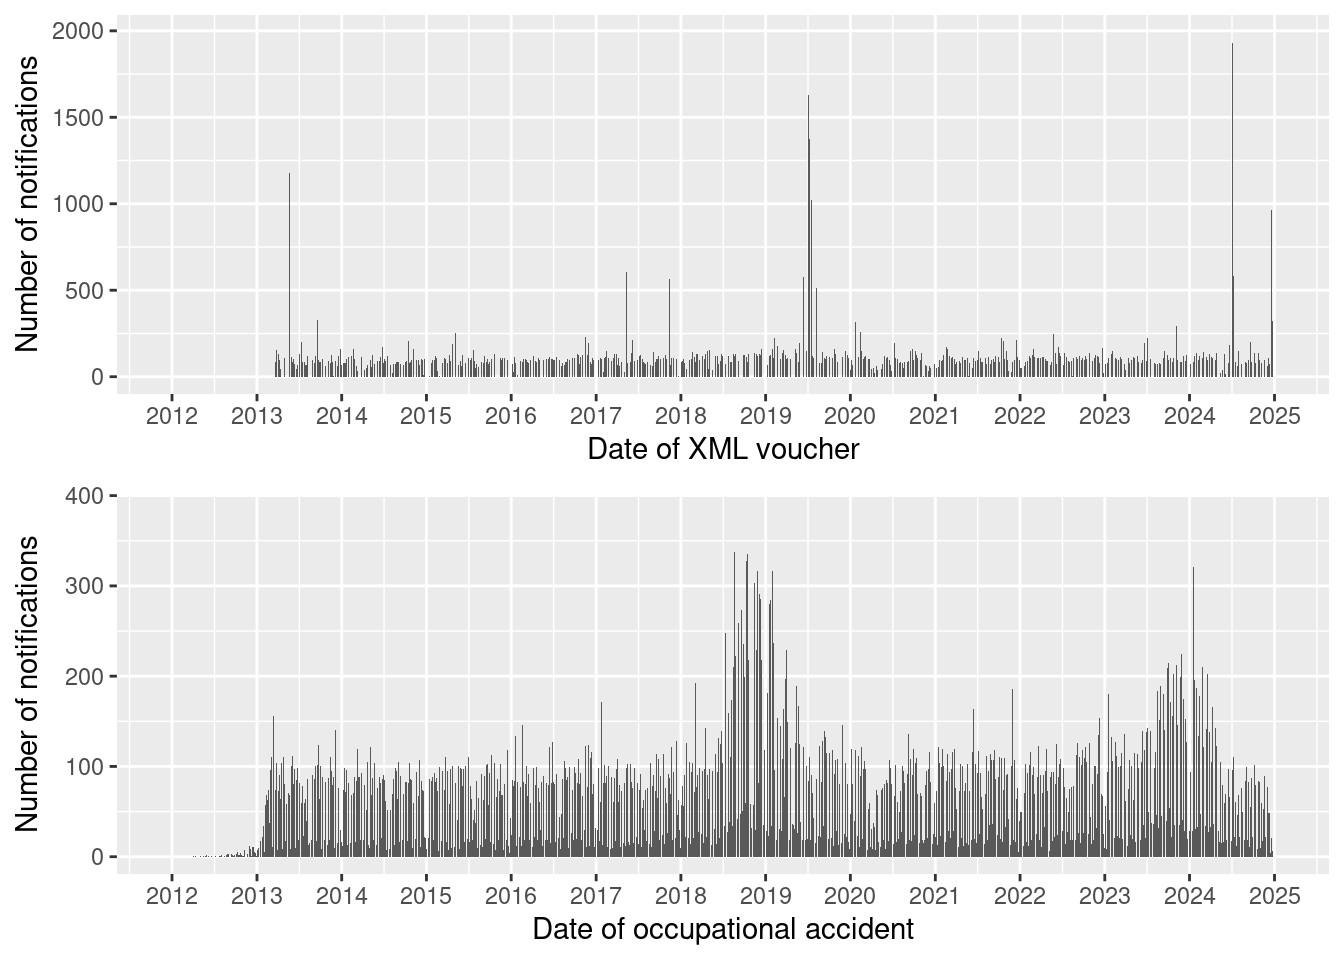
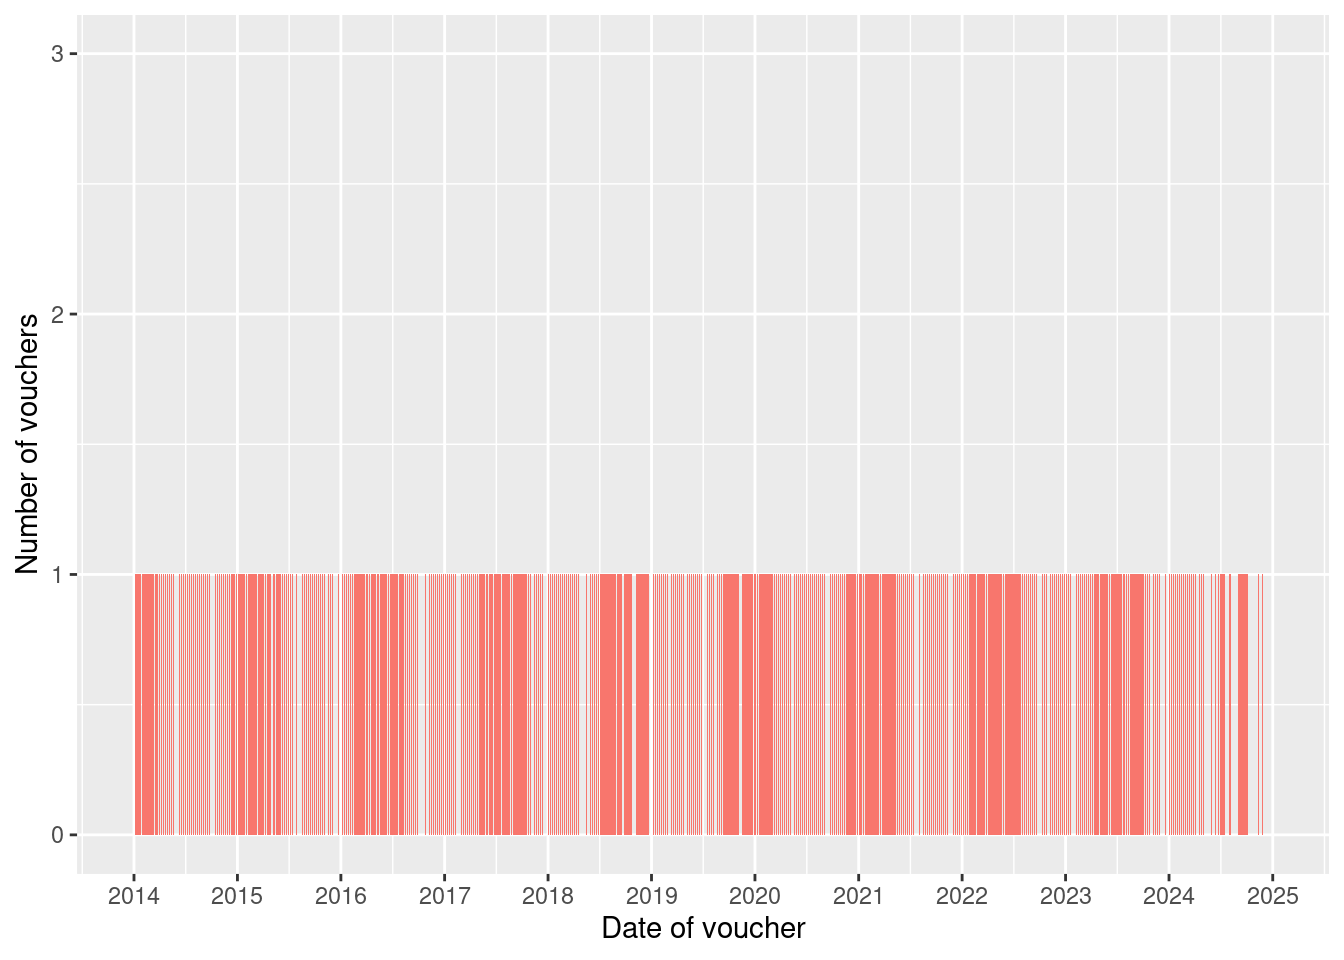
When we take a first look at whole of vouchers (a voucher is a single XML file consisting of multiple Occupational Accident File (with FEDRIS specific accident number faonr or NRACCF) (OAF) notifications) and the number of OA file notifications (or updates) over time in Figure 2.3, we clearly see the start-up period of the FARAO-batch process in 2013 and historical data uploads down to 2012. This gives us a first sign that taking 2014-01-01 as a starting point for our study might be a good choice. Peaks in the number of notifications for certain days will be discussed further in the data quality report.
Linking of the OA notifications to the customers of Liantis ESPP and PS is only possible via the CBE number of the employer in the correct time period. In the next steps we examine this further.
In a first step, we limit the FEDRIS OA declaration notifications dataset (n = 345304) for OA that happened between 2014-01-01 and 2023-12-31 (n = 293929, thus omitting 51375 notifications of OA that happened between 2012-03-07 and 2013-12-31 as well as between 2024-01-01 and 2024-12-24. In a second step, we extract the unique CBE numbers of the employers in the dataset.
The remaining notifications for OA reported during the study period originate from 20636 unique employers identified by their CBE number. Details are shown in Table 2.3.
| crbinmutual | n |
|---|---|
| FALSE | 8229 |
| TRUE | 12407 |
In Table 2.4, the number of notifications by mutual Liantis ESPP and PS customers is shown.
| crbinmutual | n |
|---|---|
| FALSE | 203319 |
| TRUE | 90619 |
About 12407 (60.12%) unique employers with accident declarations can be linked to mutual customers of Liantis ESPP and PS. The (90619) notifications (30.83%) within these mutual customers originate from 52240 unique employees.
- total number of notifications: 293938
- total number of unique mutual Liantis ESPP and PS employers with notifications: 12407 (60.12%)
- total number of unique Liantis ESPP only employers with notifications: 8229 (39.88%)
- total number of notifications within Liantis ESPP and PS mutual customers: 90619 (30.83%)
- total number of notifications within Liantis ESPP only customers: 203319 (69.17%)
2.5 Data quality assessment of the original FEDRIS notifications (identifier variables)
In this first part of the data quality assessment we will discuss a set of identifier variables mentioned in Table 2.2. These include variables with basic meta information like the sequence number of the original voucher, timestamp of the voucher and timestamp of the XML file, but also important identification information like the enterprise CBE number, the personal INSZ number and the FEDRIS specific OA file number and insurer specific dossier number for the OA itself.
2.5.1 Voucher sequence number and dates are always present, although peaks occur in time
The OA notifications are sent in batches. Each batch has a voucher number and we expect one voucher being sent a day. Within a batch (voucher), multiple accident notifications are present. All parsed notifications have a voucher number and a timestamp of the voucher sent, there are no missing data.
Looking at the number of notifications in time, an arbitrary cutoff was set at 200 notifications per day to identify days with a high number of notifications. The number of notifications per day is shown in the following Figure 2.4. Since the dataset is filtered on OA dates between 2014-01-01 and 2023-12-31, no data before 2014-01-01 is present, but vouchers and notifications may be received until a year after happening (until 2024-12-31).
The top ten days with the highest numbers of notifications are listed in the following Table 2.5.
| dateVoucher | nNot | nVouch | peaknotif | peaknvouch |
|---|---|---|---|---|
| 2024-07-01 | 1939 | 1 | TRUE | FALSE |
| 2019-07-04 | 1869 | 1 | TRUE | FALSE |
| 2024-07-04 | 1811 | 1 | TRUE | FALSE |
| 2019-07-08 | 1675 | 1 | TRUE | FALSE |
| 2019-07-12 | 1659 | 1 | TRUE | FALSE |
| 2019-07-05 | 1627 | 1 | TRUE | FALSE |
| 2019-07-19 | 1591 | 1 | TRUE | FALSE |
| 2021-01-20 | 1564 | 1 | TRUE | FALSE |
| 2019-07-16 | 1454 | 1 | TRUE | FALSE |
| 2019-07-03 | 1384 | 1 | TRUE | FALSE |
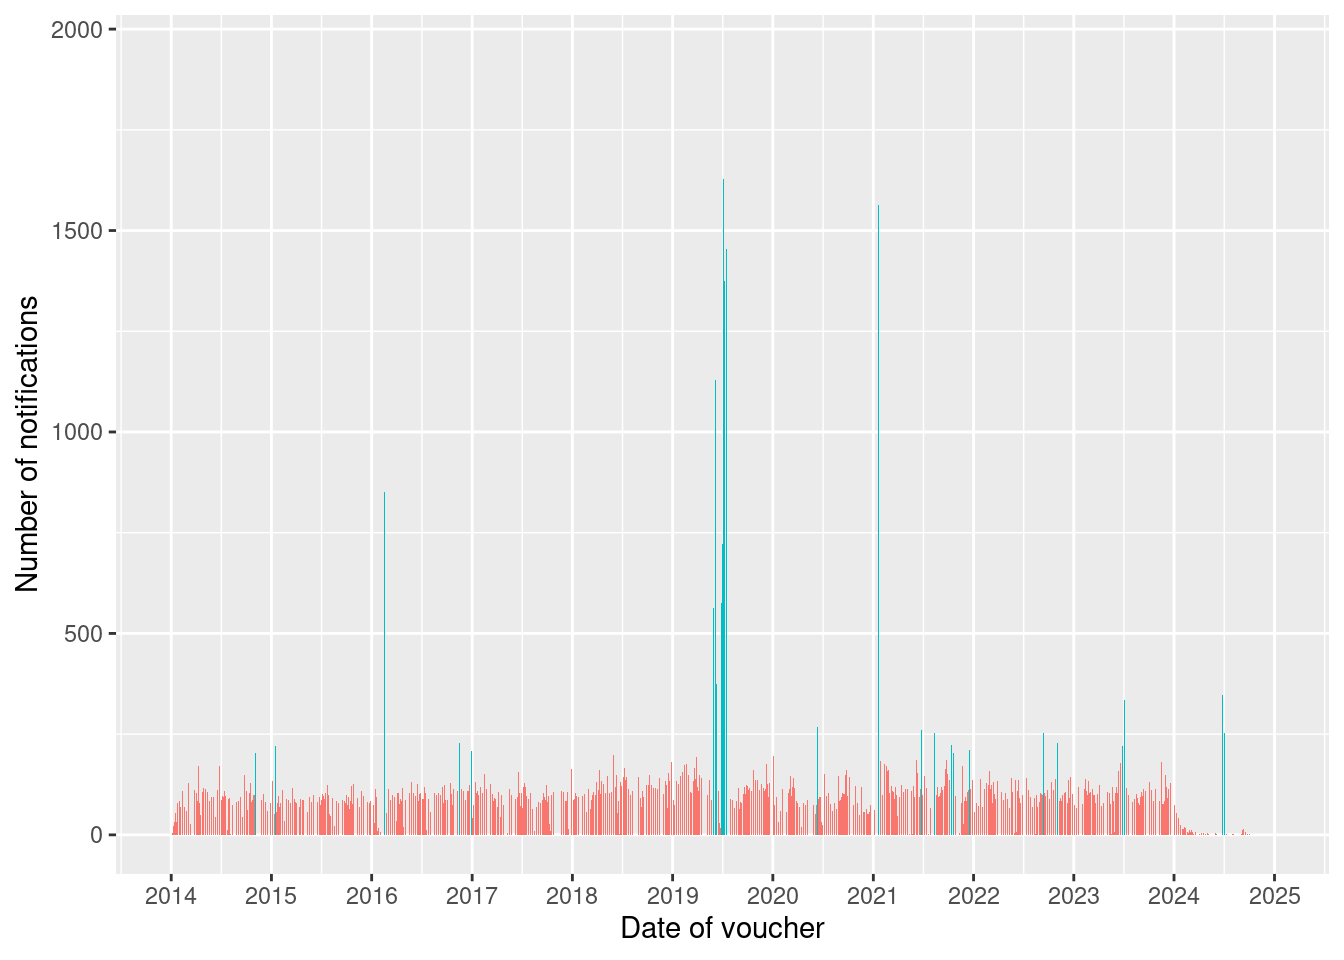
We expected only one voucher to be sent per day. However, we found about 10 days with multiple vouchers sent. The number of vouchers per day is shown in the following Figure 2.5.
All days with more than one voucher per day are listed with their numbers of notifications per day in following Table 2.6.
| dateVoucher | nNot | nVouch | peaknotif | peaknvouch |
|---|---|---|---|---|
| 2017-11-13 | 567 | 2 | TRUE | TRUE |
| 2018-10-30 | 546 | 3 | TRUE | TRUE |
| 2016-05-12 | 308 | 2 | TRUE | TRUE |
| 2015-11-27 | 183 | 2 | FALSE | TRUE |
| 2017-11-16 | 169 | 2 | FALSE | TRUE |
| 2015-09-11 | 168 | 2 | FALSE | TRUE |
| 2015-06-11 | 150 | 2 | FALSE | TRUE |
| 2014-03-20 | 145 | 3 | FALSE | TRUE |
| 2019-03-18 | 134 | 2 | FALSE | TRUE |
| 2017-01-10 | 121 | 2 | FALSE | TRUE |
Summary voucher numbers and dates
- total number of notifications: 293938
- total number of vouchers: 2603
- total number of days with multiple vouchers: 10
- percentage of missing vouchers numbers: 0%
- percentage of missing voucher number dates: 0%
In the following paragraphs we will further examine in which degree the peaks in vouchers or notification numbers represent possible duplicate notifications.
2.5.2 A minor fraction of the unique personal identifier numbers (INSZ numbers) appear to be BIS-registry numbers
The INSZ number is an eleven digit unique identifier for each person living and/or working in Belgium and is generally a combination of a person’s reversed birthdate (six digits in the format yymmdd) followed by an additional subset of five specific digits (RN or rijksregister numbers). A subset of INSZ numbers that do not follow this general format can be identified as BIS or bis-register numbers. More details on the INSZ, RN and BIS-registry number can be found on the KSZ-registers page. While the structured communication protocol mentions the personal identification number within NSSO (INSZ number) (insznr) as NRNAT, it can only be found in the KSZ database as INSZ. The variable is present in the XML file under the XML tag <ssin>.
Summary personal identifiers
- total number of notifications: 293938
- total number of unique personal identifiers: 161696
- percentage of missing insznr: 0%
- percentage of BIS-registry numbers: 3.46%
2.5.3 A classic company identifier number (CBE number) is always present
All Belgian companies have a unique company registration number (CBE number), which is always present in the notifications. Since January 2023, it is advised to use 10 digit CBE numbers in stead of 9 digit CBE numbers. In our dataset however, only 9 digit CBE numbers are present. The KSZ knows this variable in its database as NRBCEEMPL. The variable is present in the XML file under the XML tag <enterpriseNumber>.
Summary company identifiers
2.5.4 Insurer identifiers are always present albeit not always with leading zero’s
Information about the insurer is always present in the notifications. KSZ does not give details about the NRASSBCSS variable in its data warehouse. Our analysis shows that the insurer identifier seems to be a 4 digit number in almost all of the notifications. Further details on these insurers can be found in FEDRIS’ list of insurers of occupational accidents, in the NSSO glossarium online annex 20 or older versions of this same annex 20 with information on the ‘wetsverzekeraars’. The variable is present in the XML file under the XML tag <insuranceCompanyNumber>.
It appears that in 117 notifications, the insurer number consists of less than 4 characters. These cases all occurred between 2015-10-26 and 2015-10-30 (a time span of 4 days).
Data Quality Alert: mind the leading zero’s
All insurer numbers were padded with leading zero’s up to four characters in total.
Summary insurer identifiers
- total number of notifications: 293938
- total number of unique insurer identifiers before correction: 21
- total number of unique insurer identifiers after correction: 17
- percentage of missing insurer numbers: 0%
2.5.5 Insurer dossier numbers are always present (but not unique across insurers) and unique OAF numbers do not identify unique occupational accidents
In the process of an OA notification, the employer (or its representative) will notify the accident to the insurer. The OA will be assigned a dossier number by the insurer NRACC and can subsequently be transmitted to FEDRIS where it will be assigned an OAF number NRACCF. The OA notifications (an initial first notification and potentially one or more updates concerning the same accident) of the Liantis customers (the government uses the CBE number of these companies to identify Liantis ESPP as their ESPP) are transmitted in bulk (normally one XML batch or voucher per day) to Liantis ESPP. Each notification contains next to the CBE number of the company and INSZ number of the victim a dossier number (from the insurer) as well as an OAF number (from FEDRIS). The OAF number variable is present in the XML file under the XML tag <oafAccidentFileNumber>. The KSZ still knows the insurer dossier number variable as NRACC although it indicates the variable is no longer in use since 31/12/2004. The variable is present in the XML file under the XML tag <caseNumber>.
Data Quality Alert: insurer dossier numbers (or OAF numbers) do not uniquely identify a single occupational accident
- the same persons can have the same insurer dossier numbers (and OAF numbers) from the same insurer in the same or in different years; these notifications can be considered as duplicates (see Table 2.7)
- the dossier numbers of the different insurers are not unique across different occupational accidents with different OAF numbers: different persons from different companies can have a same insurer dossier number in different years or even the same years from a different insurer but cannot be considered as duplicates (see Table 2.8)
- the same persons can have different dossier numbers and OAF numbers in the same years for a same date or different date of occupational accident, it is unclear whether these notifications should be considered as duplicates (see Table 2.9)
We examined duplicates of the dossier number, combination of dossier number and number of the insurer, OAF number and combination of OAF, dossier and number of the insurer.
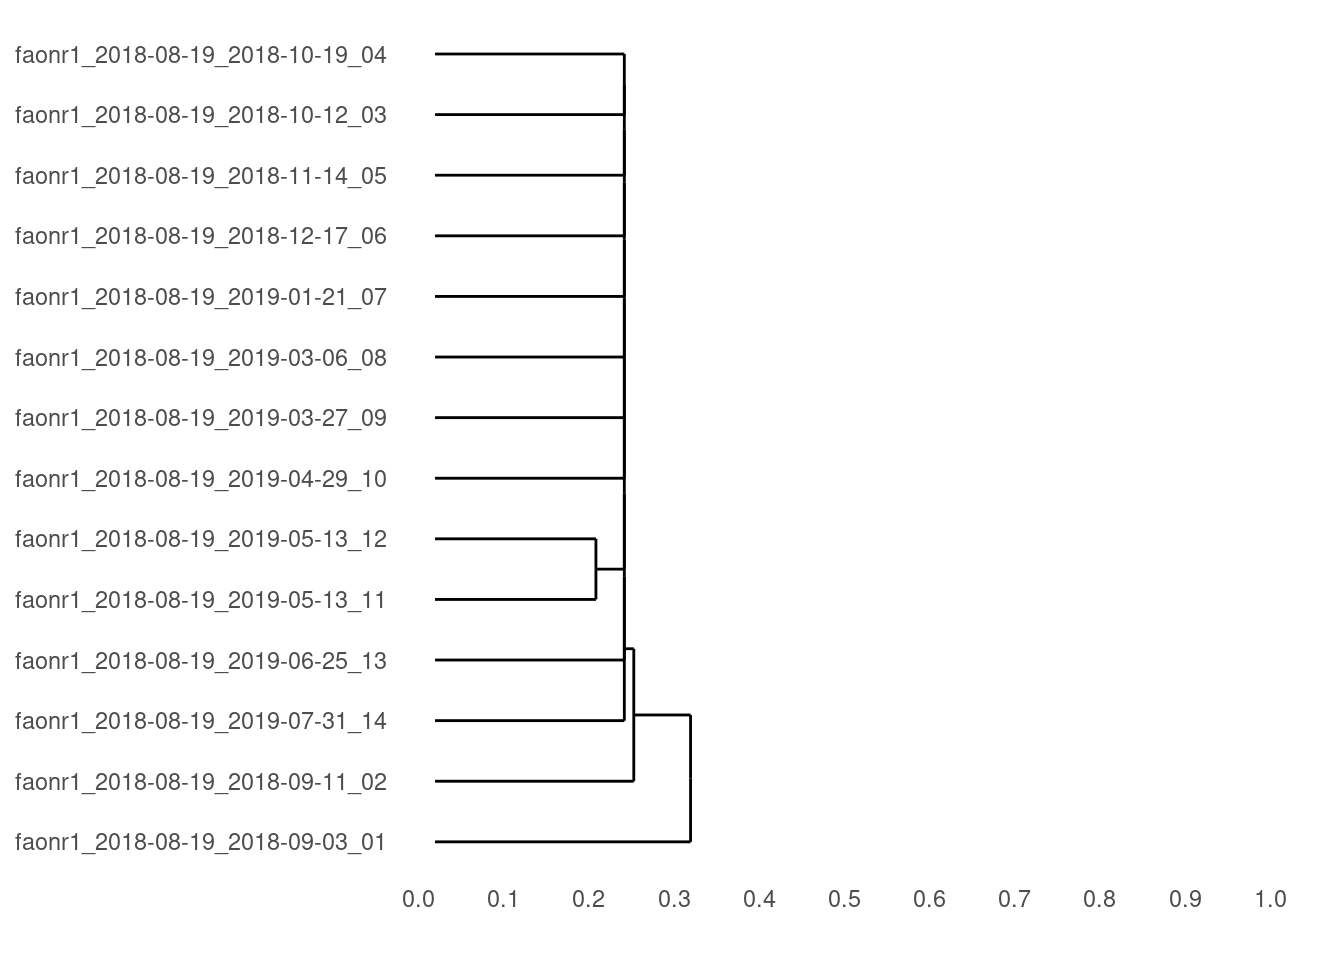
In Table 2.7 we see an example of a single OA, with a single dossier number of the insurer and a single OAF number but with multiple updates ‘datetimefaofile’. We could assume that the last update contains the most recent information concerning the OA.
| dateOA | crbnr | insznr | faonr | InsDos | nFao | nInsDos | dupdos | dupinsdos | dupfao | dupfaoinsdos | dupinsznrdateOA | dupinsznrdateOAfaonr | dtfile |
|---|---|---|---|---|---|---|---|---|---|---|---|---|---|
| 2018-08-19 | A | 1 | faonr1 | ins1_dos1 | 14 | 14 | FALSE | FALSE | FALSE | FALSE | FALSE | FALSE | 2018-09-03 06:19:46 |
| 2018-08-19 | A | 1 | faonr1 | ins1_dos1 | 14 | 14 | TRUE | TRUE | TRUE | TRUE | TRUE | TRUE | 2018-09-11 07:33:54 |
| 2018-08-19 | A | 1 | faonr1 | ins1_dos1 | 14 | 14 | TRUE | TRUE | TRUE | TRUE | TRUE | TRUE | 2018-10-12 07:02:21 |
| 2018-08-19 | A | 1 | faonr1 | ins1_dos1 | 14 | 14 | TRUE | TRUE | TRUE | TRUE | TRUE | TRUE | 2018-10-19 07:13:22 |
| 2018-08-19 | A | 1 | faonr1 | ins1_dos1 | 14 | 14 | TRUE | TRUE | TRUE | TRUE | TRUE | TRUE | 2018-11-14 07:25:51 |
| 2018-08-19 | A | 1 | faonr1 | ins1_dos1 | 14 | 14 | TRUE | TRUE | TRUE | TRUE | TRUE | TRUE | 2018-12-17 06:15:58 |
| 2018-08-19 | A | 1 | faonr1 | ins1_dos1 | 14 | 14 | TRUE | TRUE | TRUE | TRUE | TRUE | TRUE | 2019-01-21 06:27:45 |
| 2018-08-19 | A | 1 | faonr1 | ins1_dos1 | 14 | 14 | TRUE | TRUE | TRUE | TRUE | TRUE | TRUE | 2019-03-06 16:56:50 |
| 2018-08-19 | A | 1 | faonr1 | ins1_dos1 | 14 | 14 | TRUE | TRUE | TRUE | TRUE | TRUE | TRUE | 2019-03-27 07:22:49 |
| 2018-08-19 | A | 1 | faonr1 | ins1_dos1 | 14 | 14 | TRUE | TRUE | TRUE | TRUE | TRUE | TRUE | 2019-04-29 06:18:25 |
| 2018-08-19 | A | 1 | faonr1 | ins1_dos1 | 14 | 14 | TRUE | TRUE | TRUE | TRUE | TRUE | TRUE | 2019-05-13 06:24:04 |
| 2018-08-19 | A | 1 | faonr1 | ins1_dos1 | 14 | 14 | TRUE | TRUE | TRUE | TRUE | TRUE | TRUE | 2019-05-13 06:24:04 |
| 2018-08-19 | A | 1 | faonr1 | ins1_dos1 | 14 | 14 | TRUE | TRUE | TRUE | TRUE | TRUE | TRUE | 2019-06-25 06:52:09 |
| 2018-08-19 | A | 1 | faonr1 | ins1_dos1 | 14 | 14 | TRUE | TRUE | TRUE | TRUE | TRUE | TRUE | 2019-07-31 06:53:16 |
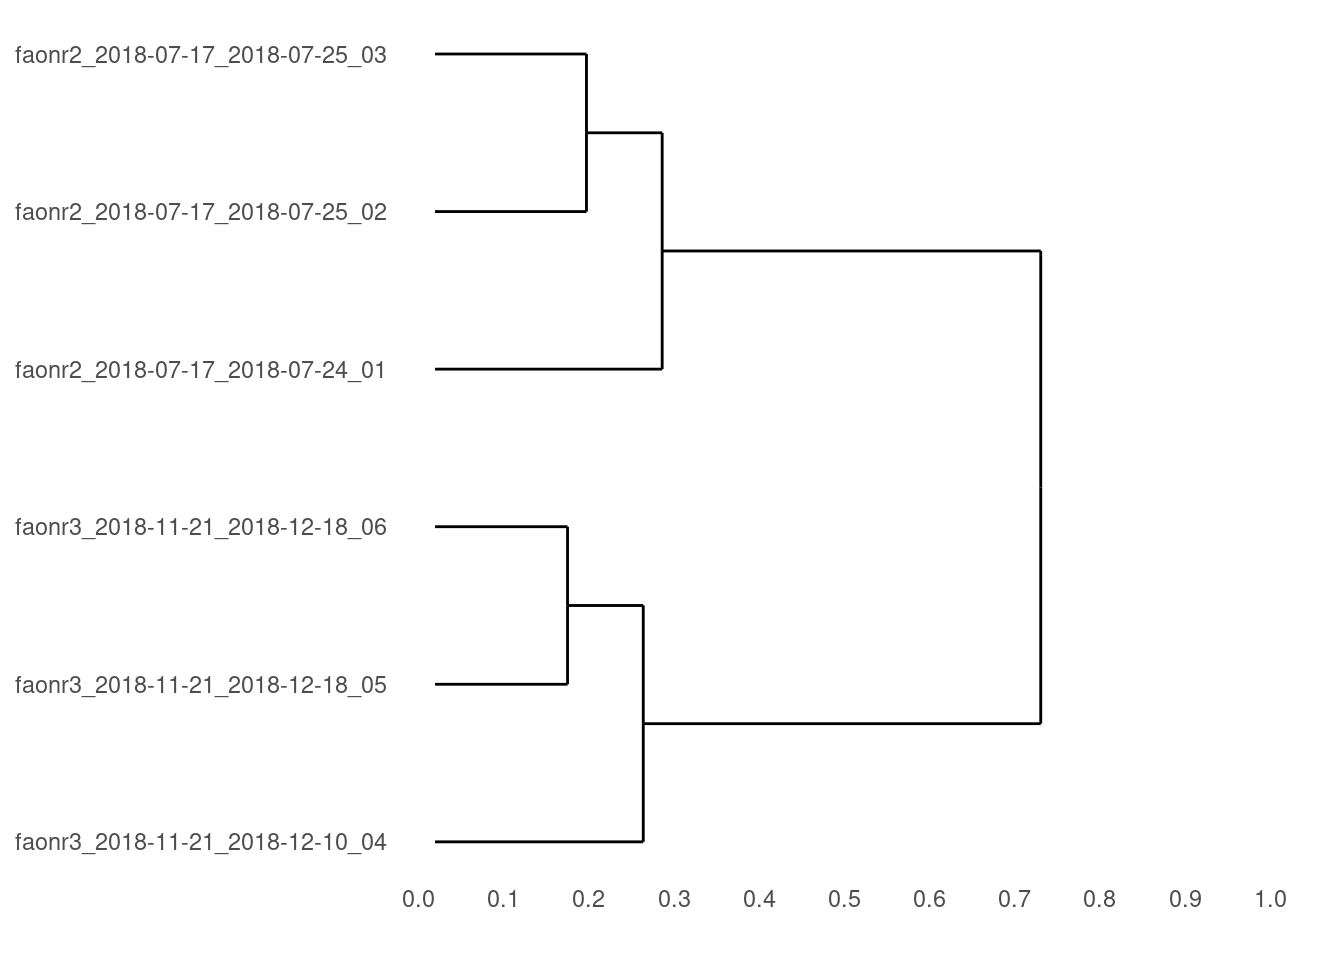
In Table 2.8 we see an example of how a single dossier number (without combination with the insurer) could lead to different OAs. The dossier number of the insurer could e.g. always be combined with the number of the insurer ‘InsDos’ to overcome this problem. The ‘faonr’ in first instance seemed to overcome this problem, however, Table 2.9 shows this is not always the case.
| dateOA | crbnr | insznr | faonr | InsDos | nFao | nInsDos | dupdos | dupinsdos | dupfao | dupfaoinsdos | dupinsznrdateOA | dupinsznrdateOAfaonr | dtfile |
|---|---|---|---|---|---|---|---|---|---|---|---|---|---|
| 2018-07-17 | B | 2 | faonr2 | ins2_dos2 | 3 | 3 | FALSE | FALSE | FALSE | FALSE | FALSE | FALSE | 2018-07-24 06:47:59 |
| 2018-07-17 | B | 2 | faonr2 | ins2_dos2 | 3 | 3 | TRUE | TRUE | TRUE | TRUE | TRUE | TRUE | 2018-07-25 06:40:45 |
| 2018-07-17 | B | 2 | faonr2 | ins2_dos2 | 3 | 3 | TRUE | TRUE | TRUE | TRUE | TRUE | TRUE | 2018-07-25 06:40:45 |
| 2018-11-21 | C | 3 | faonr3 | ins3_dos2 | 3 | 3 | TRUE | FALSE | FALSE | FALSE | FALSE | FALSE | 2018-12-10 06:29:15 |
| 2018-11-21 | C | 3 | faonr3 | ins3_dos2 | 3 | 3 | TRUE | TRUE | TRUE | TRUE | TRUE | TRUE | 2018-12-18 06:24:22 |
| 2018-11-21 | C | 3 | faonr3 | ins3_dos2 | 3 | 3 | TRUE | TRUE | TRUE | TRUE | TRUE | TRUE | 2018-12-18 06:24:22 |
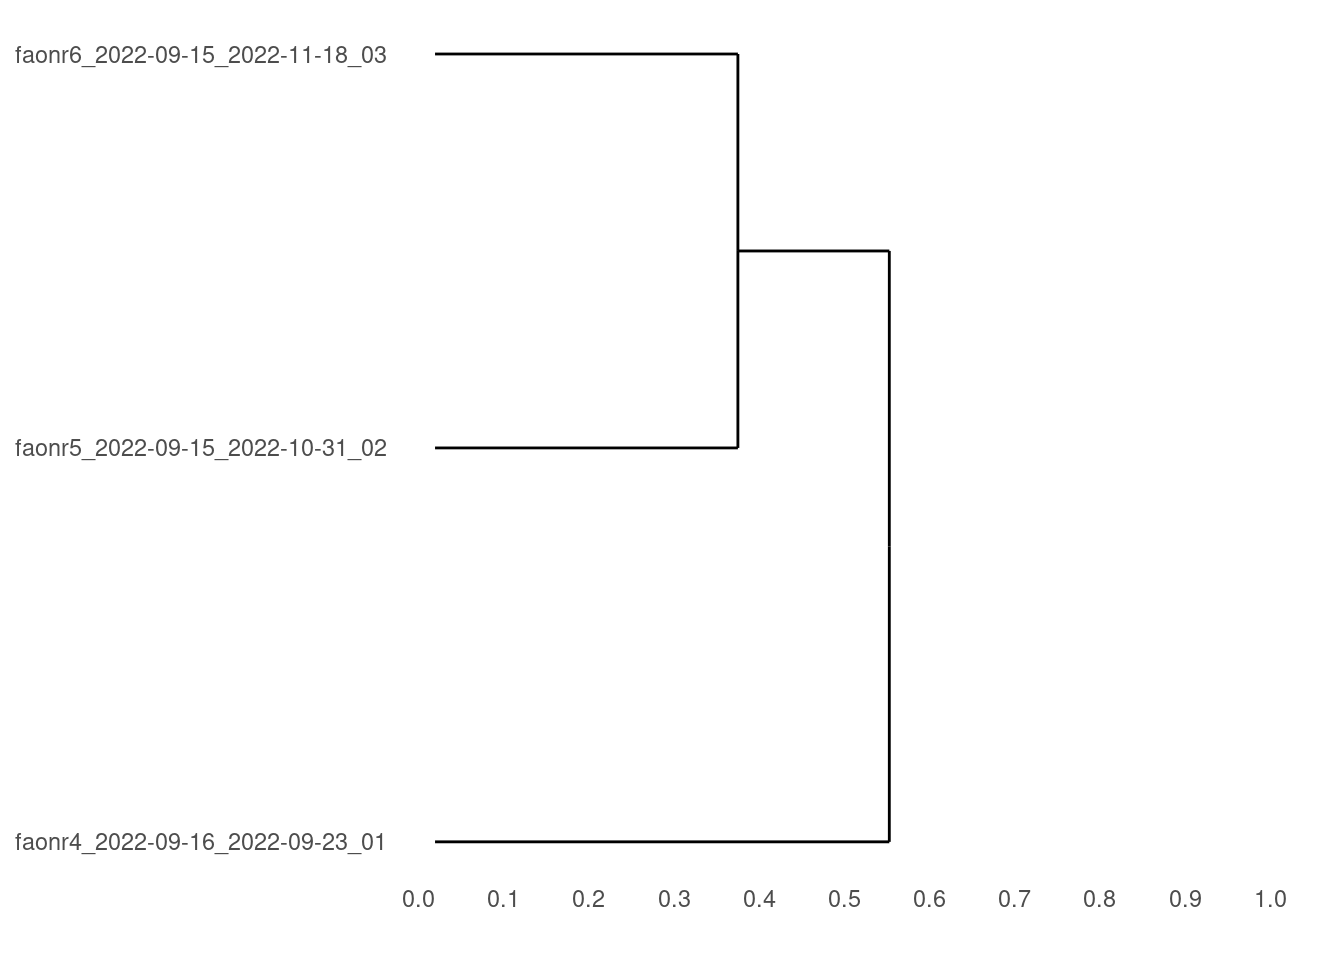
In the following example, we demonstrate a case of a single person, working in a single company, experiencing one OA. Table 2.9 however shows that for this single OA, two accident dates occur, two dossier numbers of the insurer exist, and even three different OAF numbers are found. Thus, we can conclude that an faonr is not a unique identifier for a single OA. This is a very important conclusion. This means that without any further information, the faonr from the OA notifications cannot be directly used to identify single OAs.
| dateOA | crbnr | insznr | faonr | InsDos | nFao | nInsDos | dupdos | dupinsdos | dupfao | dupfaoinsdos | dupinsznrdateOA | dupinsznrdateOAfaonr | dtfile |
|---|---|---|---|---|---|---|---|---|---|---|---|---|---|
| 2022-09-16 | D | 4 | faonr4 | ins4_dos3 | 1 | 1 | FALSE | FALSE | FALSE | FALSE | FALSE | FALSE | 2022-09-23 05:06:11 |
| 2022-09-15 | D | 4 | faonr5 | ins4_dos4 | 1 | 2 | FALSE | FALSE | FALSE | FALSE | FALSE | FALSE | 2022-10-31 06:01:44 |
| 2022-09-15 | D | 4 | faonr6 | ins4_dos4 | 1 | 2 | TRUE | TRUE | FALSE | FALSE | TRUE | FALSE | 2022-11-18 06:01:28 |
Risks for research, analytics and development
The identifier appearing under the <oafAccidentFileNumber> XML tag, which corresponds to the FEDRIS faonr or NRACCF, cannot be considered a unique identifier for a single occupational accident. As a result, without additional contextual information or validation, analyses of notifications based solely on this identifier cannot be assumed to reflect analyses of distinct occupational accidents.
Examining duplicate notifications proved to be quite complex. At the Fedris OAF number (also NRACCF) (faonr) level (or faonr, insurer and dossier number combination) only 218916 proved to be linked to a unique faonr. Table 2.10 below summarises the most important findings.
| dupdos | dupinsdos | dupfao | dupfaoinsdos | n | perc |
|---|---|---|---|---|---|
| FALSE | FALSE | FALSE | FALSE | 218580 | 74.36 |
| TRUE | FALSE | FALSE | FALSE | 303 | 0.10 |
| TRUE | TRUE | FALSE | FALSE | 33 | 0.01 |
| TRUE | TRUE | TRUE | TRUE | 75022 | 25.52 |
Data Quality Alert: massive duplication needs to be addressed and examined further
- at the level of OAF number (or the combination of OAF number, dossier number and insurer number), 75022 (25.52%) duplicate notifications can be identified
- we could assume that at the combined level of OAF number, dossier number and insurer number, the notification with the latest timestamp is the most correct one
- however, since a single OAF number does not uniquely identify a single occupational accident, keeping only the last notification within a single OAF number does not guarantee a 1-1 link with an occupational accident
Summary Insurer and FEDRIS identifiers
- total number of notifications: 293938
- total number of notifications with a unique insurer dossier: 218883
- total number of notifications with a duplicated insurer dossier: 75055
- percentage of notifications with a unique insurer dossier: 74.47%
- total number of notifications with a unique OAF number: 218916
- total number of notifications with a duplicated OAF number: 75022
- percentage of notifications with a unique OAF number: 74.48%
In order to clarify the size of the problem of multiple identifiers for a potential same OA, we summarised the number of notifications within a unique OAF and insurer dossier number combination per person and per day during the study period.
The following example presented in Table 2.11 again demonstrates the possibility that multiple OAF numbers can be identified for a same victim on the same day. If we take the assumption that an individual will not experience more than one OA on a same day, only three out of thirteen notifications should be retained for further analysis.
| dateOA | crbnr | insznr | faonr | InsDos | nFao | nInsDos | dupdos | dupinsdos | dupfao | dupfaoinsdos | dupinsznrdateOA | dupinsznrdateOAfaonr | dtfile |
|---|---|---|---|---|---|---|---|---|---|---|---|---|---|
| 2018-08-29 | E | 5 | faonr7 | ins5_dos7 | 3 | 3 | FALSE | FALSE | FALSE | FALSE | FALSE | FALSE | 2018-09-20 10:46:21 |
| 2018-08-29 | E | 5 | faonr7 | ins5_dos7 | 3 | 3 | TRUE | TRUE | TRUE | TRUE | TRUE | TRUE | 2018-09-20 10:46:21 |
| 2018-08-29 | E | 5 | faonr7 | ins5_dos7 | 3 | 3 | TRUE | TRUE | TRUE | TRUE | TRUE | TRUE | 2018-09-20 10:46:21 |
| 2018-08-29 | E | 5 | faonr8 | ins5_dos8 | 3 | 3 | FALSE | FALSE | FALSE | FALSE | TRUE | FALSE | 2018-09-27 10:58:32 |
| 2018-08-29 | E | 5 | faonr8 | ins5_dos8 | 3 | 3 | TRUE | TRUE | TRUE | TRUE | TRUE | TRUE | 2018-11-06 10:40:56 |
| 2018-08-29 | E | 5 | faonr8 | ins5_dos8 | 3 | 3 | TRUE | TRUE | TRUE | TRUE | TRUE | TRUE | 2018-11-06 10:40:56 |
| 2018-08-29 | E | 5 | faonr9 | ins5_dos9 | 1 | 1 | FALSE | FALSE | FALSE | FALSE | TRUE | FALSE | 2018-10-05 11:31:40 |
| 2018-08-29 | E | 5 | faonr10 | ins5_dos10 | 3 | 3 | FALSE | FALSE | FALSE | FALSE | TRUE | FALSE | 2018-10-19 10:55:03 |
| 2018-08-29 | E | 5 | faonr10 | ins5_dos10 | 3 | 3 | TRUE | TRUE | TRUE | TRUE | TRUE | TRUE | 2019-01-02 10:34:59 |
| 2018-08-29 | E | 5 | faonr10 | ins5_dos10 | 3 | 3 | TRUE | TRUE | TRUE | TRUE | TRUE | TRUE | 2019-01-02 10:34:59 |
| 2022-03-23 | E | 5 | faonr11 | ins5_dos11 | 2 | 2 | FALSE | FALSE | FALSE | FALSE | FALSE | FALSE | 2022-03-29 09:47:27 |
| 2022-03-23 | E | 5 | faonr11 | ins5_dos11 | 2 | 2 | TRUE | TRUE | TRUE | TRUE | TRUE | TRUE | 2022-07-20 09:50:28 |
| 2023-02-15 | E | 5 | faonr12 | ins5_dos12 | 1 | 1 | FALSE | FALSE | FALSE | FALSE | FALSE | FALSE | 2023-02-20 12:47:09 |
In Table 2.12 summary statistics for unique FaoInsDos per dateOA for the victim are retained.
| insznr | dateOA | FaoInsDos | nnotperFaoInsDosperdateOA | nnotperinszperdateOA | nFaoInsDosperdateOA | multinFaoInsDosperdateOA |
|---|---|---|---|---|---|---|
| 5 | 2018-08-29 | faonr7_ins5_dos7 | 3 | 10 | 4 | TRUE |
| 5 | 2018-08-29 | faonr8_ins5_dos8 | 3 | 10 | 4 | TRUE |
| 5 | 2018-08-29 | faonr9_ins5_dos9 | 1 | 10 | 4 | TRUE |
| 5 | 2018-08-29 | faonr10_ins5_dos10 | 3 | 10 | 4 | TRUE |
| 5 | 2022-03-23 | faonr11_ins5_dos11 | 2 | 2 | 1 | FALSE |
| 5 | 2023-02-15 | faonr12_ins5_dos12 | 1 | 1 | 1 | FALSE |
In Table 2.13 summary statistics for unique dateOA for the victim are retained.
| insznr | dateOA | nFaoInsDosperdateOA | multinFaoInsDosperdateOA | ndateOAperinsznr | dupdateOAperinsnr |
|---|---|---|---|---|---|
| 5 | 2018-08-29 | 4 | TRUE | 1 | FALSE |
| 5 | 2022-03-23 | 1 | FALSE | 1 | FALSE |
| 5 | 2023-02-15 | 1 | FALSE | 1 | FALSE |
Across the whole original dataset, 666 unique victims out of all 161696 unique individuals with OA notifications (0.41%) have multiple unique OAF number and insurer dossier number combinations per day during the study period. It is not clear whether the assumption is valid that the notification with the latest timestamp is the most correct one. Clarity is required on which OAF numbers should be retained and which could be discarded.
In Table 2.14 is shown that up to four different OAF numbers may be assigned for a same victim on a same day of OA, as was already shown in the example above.
| nFaoInsDosperdateOA | n |
|---|---|
| 1 | 217620 |
| 2 | 666 |
| 3 | 5 |
| 4 | 1 |
We further examined the problem by means of a hierarchical clustering method within different sets of notifications related to one or more OAs. More details can be found in the R script functions/clusterOA.R. The function contained in this script is based on the calculation of the Hamming distance between all provided notifications. Unique notifications are identified by pasting together the OAF number, the date of the OA, the date of OAF file and the rowid of the proved set of notifications. The function returns a list with three objects:
- the similarity percentage between all different pairs of notifications
- a k-means clustering result for a provided number of expected clusters (expected number of accidents)
- a dendrogram based on the dissimilarity (a distance measure equal to one minus the similarity)
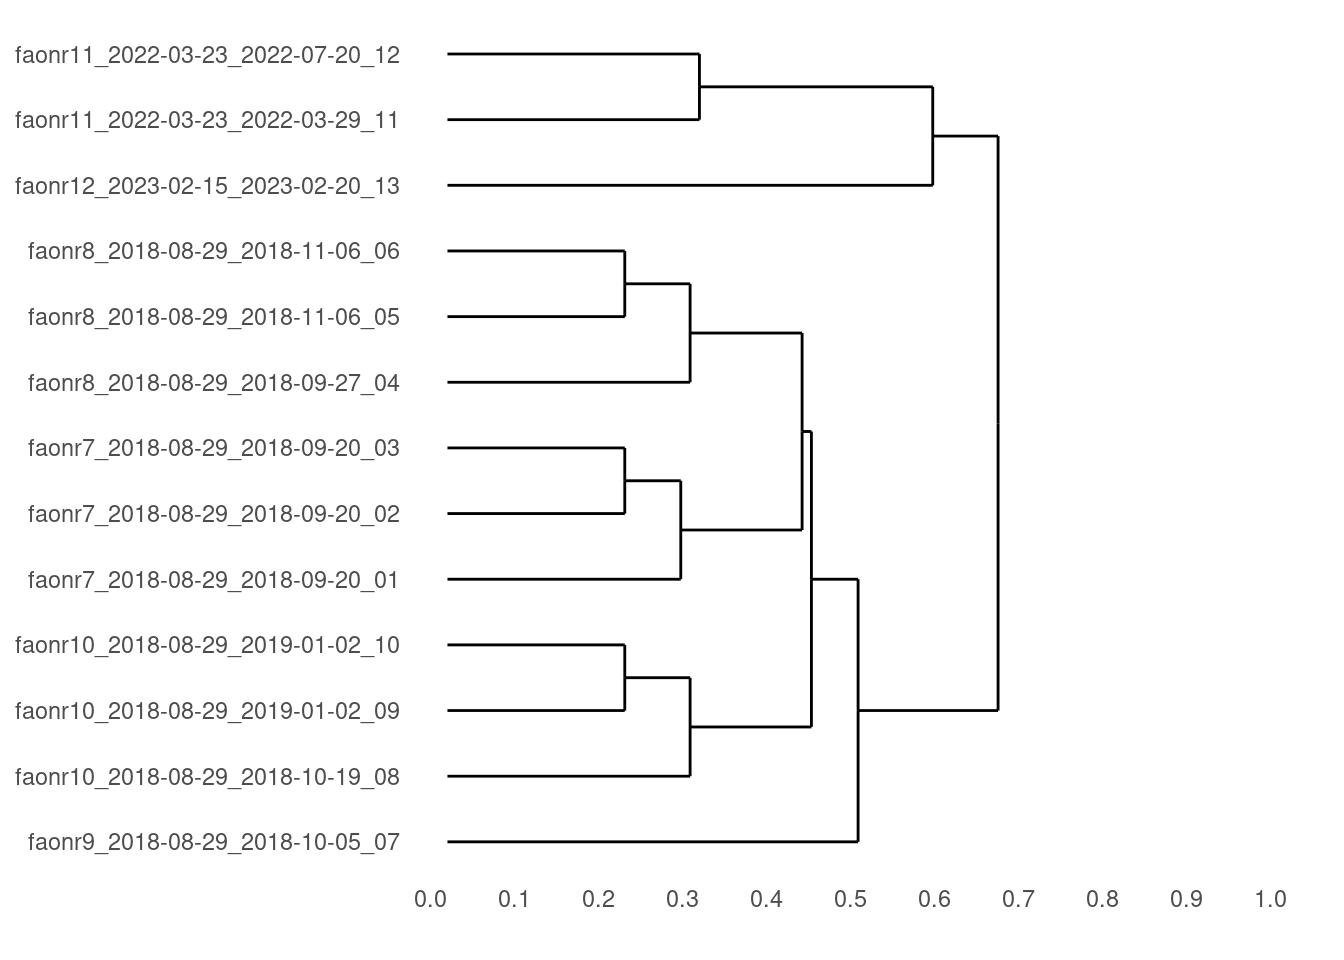
Let’s return to example 1 presented in Table 2.7. The graphical result of the clustering analysis is shown in the following Figure 2.6. Probably only the last notification should be retained.
Let’s return to example 2 presented in Table 2.8. The graphical result of the clustering analysis is shown in the following Figure 2.7. Only the last notification within each OAF number should be retained. Dossier numbers are not unique when not combined with the insurer number.
Let’s return to example 3 presented in Table 2.9. The graphical result of the clustering analysis is shown in the following Figure 2.8. Since three different OAF numbers represent the same accident, it is not clear which one should be retained for further analysis.
Let’s return to example 4 presented in Table 2.11. The graphical result of the clustering analysis is shown in the following Figure 2.9. Since this person experienced OAs on three different days, we expect to retain only three out of six unique last notifications within each OAF number.
Data Quality Alert: the last notification for a unique faonr does not identify a unique occupational accident (faonr alone are not enough)
- Table 2.9 and Table 2.11 as well as Figure 2.8 and Figure 2.9 clearly demonstrate that a single OAF number does not uniquely identify a single occupational accident
- keeping only the last notification within a single OAF number does not guarantee a 1-1 link with an occupational accident
- keeping only one (e.g. the last) notification across multiple OAF number for a same victim on the same day seems at least in some cases a necessary step, but this approach does not guarantee a 1-1 link with an occupational accident
- further validation is mandatory before proceeding with the analysis
Summary concerning potential duplications
- total number of notifications: 293938
- total number of notifications with a unique OAF number: 218916
- total number of notifications with a duplicated OAF number: 75022
- percentage of notifications with a unique OAF number: 74.48%
- total number of notifications with a unique OAF number per person per day: 218971
- total number of notifications with a duplicated OAF number per person per day: 74967
- percentage of notifications with a unique OAF number per person per day: 74.5%
- total number of last notifications (across multiple OAF numbers) per person per day: 218292
- total number of all but the last notifications (accros multiple OAF numbers) per person per day with a unique OAF number: 75646
- percentage of last notifications (across multiple OAF numbers) per person per day: 74.26%
- further validation is mandatory before proceeding with the analysis
2.6 Validation process for the FEDRIS notifications
In the following section we will clarify the validation process undertaken in cooperation with the colleagues of the FEDRIS stats team.
2.6.1 A question for help to FEDRIS stats team
After drawing the conclusion that for a single (unique) OA, multiple notifications on multiple OAF numbers can coexist, we contacted the FEDRIS stats team Thursday 2024-09-19 by email for help. The OAF numbers from Table 2.9 were used as an illustration of the problem.
We asked the FEDRIS colleagues whether it was possible to provide validated data for use in the current project. The question was posed to unambiguously link all different unique OAF numbers from our dataset to important possible outcomes such as date and decision not accepted/accepted, period(s) of coupled actual absence in calendar days as well as total refunded costs through the insurer.
The initial assessment from FEDRIS 2024-09-25 was that validated data on acceptance and absence periods could be provided at OAF number level, but that details on refunded costs could only be obtained through the KSZ. This last route was not explored any further during the project.
2.6.2 A usefull answer with validated unique endpoints
The 218916 unique OAF numbers were provided to FEDRIS in Microsoft Excel .xlsx format. Data on the first nine years (2014-2022) was received 2024-10-25, and an update including the tenth year (2014-2023) was received 2024-12-19, after validation of the overall 2023 FEDRIS statistical reports by the FEDRIS management comittee 2024-12-17. All data was provided by the Database Service of the Studies and Development Department of FEDRIS. For more information, please visit the FEDRIS website.
FEDRIS provided the answer to our question in two Microsoft Excel .xlsb files (with two sheets each) after running different queries generating data in the same output format. A first .xlsb file contained the search result for the private sector, a second .xlsb file contained the search result for the public sector. Data on OA in the public sector and data on OA in the private sector are recorded in separate tables in the FEDRIS data warehouse since they follow a different route. Occupational accidents in the private sector are transmitted via automated electronic flows, whereas in the public sector, OA are transmitted through the Publiato application. The content of the resulting .xlsb files was as follows:
- a first sheet with a list of all 218916 unique FEDRIS OAF numbers (
FAONRorfaonr) from our dataset, and a column indicating whether this OAF number is found in the FEDRIS data warehouse (IN FEDRIS DWH, TRUE or FALSE, see Table 2.15) - a second sheet with the cases (
FAONR) which were found (IN FEDRIS DWH== TRUE) in the first sheet and columns with the date of the accident (DATUM ONG), final status of the dossier (STATUS) being “Aanvaard” (Accepted) or “Geweigerd” (Not accepted), place of the occuptional accident (PLAATS) being “Arbeidsplaats” (accident happening at the workplace) or “Arbeidsweg” (accident happening during commuting), begin (BEGIN PERIODE TAO) and end (EINDE PERIODE TAO) date of a temporary absence period from work (in Dutch Tijdelijke (volledige) Arbeidsongeschiktheid (TAO)), excluding the day of the accident itself (multiple periods are possible), aSTATUS PERIODE TAOwhich can be “Einde periode niet gekend” (final date of a period is not known; this means that the end of the period was either not provided by the insurer, or the period was not accepted as a period of absence from work due to an OA), “Geen TAO” (no temporary absence from work due to the OA) or “Volledige periode”, in which case theDAGEN TAOindicates the number of temporary absence from work during this period due to the OA and finallyTOTAAL DAGEN TAOin which the total absence across al periods is calculated, see Table 2.16)
| FAONR | IN FEDRIS DWH |
|---|---|
| faonr13 | TRUE |
| faonr14 | TRUE |
| faonr15 | TRUE |
| faonr16 | TRUE |
| faonr17 | TRUE |
| FAONR | DATUM ONG | STATUS | PLAATS | BEGIN PERIODE TAO | EINDE PERIODE TAO | STATUS PERIODE TAO | DAGEN TAO | TOTAAL DAGEN TAO |
|---|---|---|---|---|---|---|---|---|
| faonr13 | 2014-01-02 | Geweigerd | Arbeidsplaats | 2014-01-03 | NA | Einde periode niet gekend | 0 | 0 |
| faonr14 | 2014-01-02 | Aanvaard | Arbeidsplaats | 2014-01-02 | 2014-01-13 | Volledige periode | 11 | 11 |
| faonr15 | 2014-01-01 | Aanvaard | Arbeidsplaats | NA | NA | Geen TAO | 0 | 0 |
| faonr16 | 2014-01-02 | Aanvaard | Arbeidsplaats | 2014-01-02 | 2014-01-10 | Volledige periode | 8 | 22 |
| faonr16 | 2014-01-02 | Aanvaard | Arbeidsplaats | 2014-01-20 | 2014-01-24 | Volledige periode | 5 | 22 |
| faonr16 | 2014-01-02 | Aanvaard | Arbeidsplaats | 2014-02-01 | 2014-02-09 | Volledige periode | 9 | 22 |
| faonr17 | 2014-01-03 | Aanvaard | Arbeidsplaats | 2014-01-03 | 2014-01-05 | Volledige periode | 2 | 2 |
From the 218916 unique OAF numbers in our dataset, 217019 (99.13%) were found in the Fedris data warehouse and 1897 (0.87%) were not found. The OAF numbers that were not found in the FEDRIS data warehouse are either not linked to OAs occurring between January 1st 2014 and December 31st 2023 or were eventually deleted from the FEDRIS data warehouse. For this last category FEDRIS does not see any further possibilities to link them to another (known) OAF number.
First we examine the whole set of notifications without any filtering (all original notifications and their potential updates) (293938) (not unique!).
In Table 2.17, all notifications are split by whether they were found or not found with their OAF number in the FEDRIS data warehouse.
| yearOA | notfound | found | totnotif | pctnotfound |
|---|---|---|---|---|
| 2014 | 196 | 22717 | 22913 | 0.9 |
| 2015 | 180 | 22819 | 22999 | 0.8 |
| 2016 | 205 | 23983 | 24188 | 0.8 |
| 2017 | 206 | 24286 | 24492 | 0.8 |
| 2018 | 386 | 47389 | 47775 | 0.8 |
| 2019 | 244 | 36686 | 36930 | 0.7 |
| 2020 | 176 | 23909 | 24085 | 0.7 |
| 2021 | 228 | 27077 | 27305 | 0.8 |
| 2022 | 210 | 26299 | 26509 | 0.8 |
| 2023 | 230 | 36512 | 36742 | 0.6 |
Second, we examine the whole set of notifications with filtering (unique notifications by faonr) (218916). The result is shown in Table 2.18.
| yearOA | notfound | found | totnotif | pctnotfound |
|---|---|---|---|---|
| 2014 | 186 | 20291 | 20477 | 0.9 |
| 2015 | 169 | 20196 | 20365 | 0.8 |
| 2016 | 189 | 21181 | 21370 | 0.9 |
| 2017 | 194 | 21352 | 21546 | 0.9 |
| 2018 | 219 | 24087 | 24306 | 0.9 |
| 2019 | 183 | 24416 | 24599 | 0.7 |
| 2020 | 168 | 20105 | 20273 | 0.8 |
| 2021 | 202 | 21705 | 21907 | 0.9 |
| 2022 | 189 | 21726 | 21915 | 0.9 |
| 2023 | 198 | 21960 | 22158 | 0.9 |
In Figure 2.10, we make a comparative plot with the unique checked faonr per day (not) recovered by FEDRIS. We suspect that the OA that could not be recovered are deleted at some point during the process and were thus removed from the FEDRIS data warehouse.
Summary concerning FEDRIS validated notifications duplications
2.6.3 Filtering out duplicate and cancelled notifications after validation
Only the last validated notifications (last notification update within a same faonr with a non empty status) were retained.
In a check for duplicates within the same person with the same date of OA, only the last notification with a non empty status was retained.
The result of the filtering process is shown in the figures below. The unfiltered data (per day) is shown in the top panel, while the filtered data (per day) is shown in the bottom panel of Figure 2.11. After filtering, a dip in the number of notifications in the first quarter of 2020 still can be noticed, likely due to the Coronavirus Disease 2019 (COVID-19) pandemic.
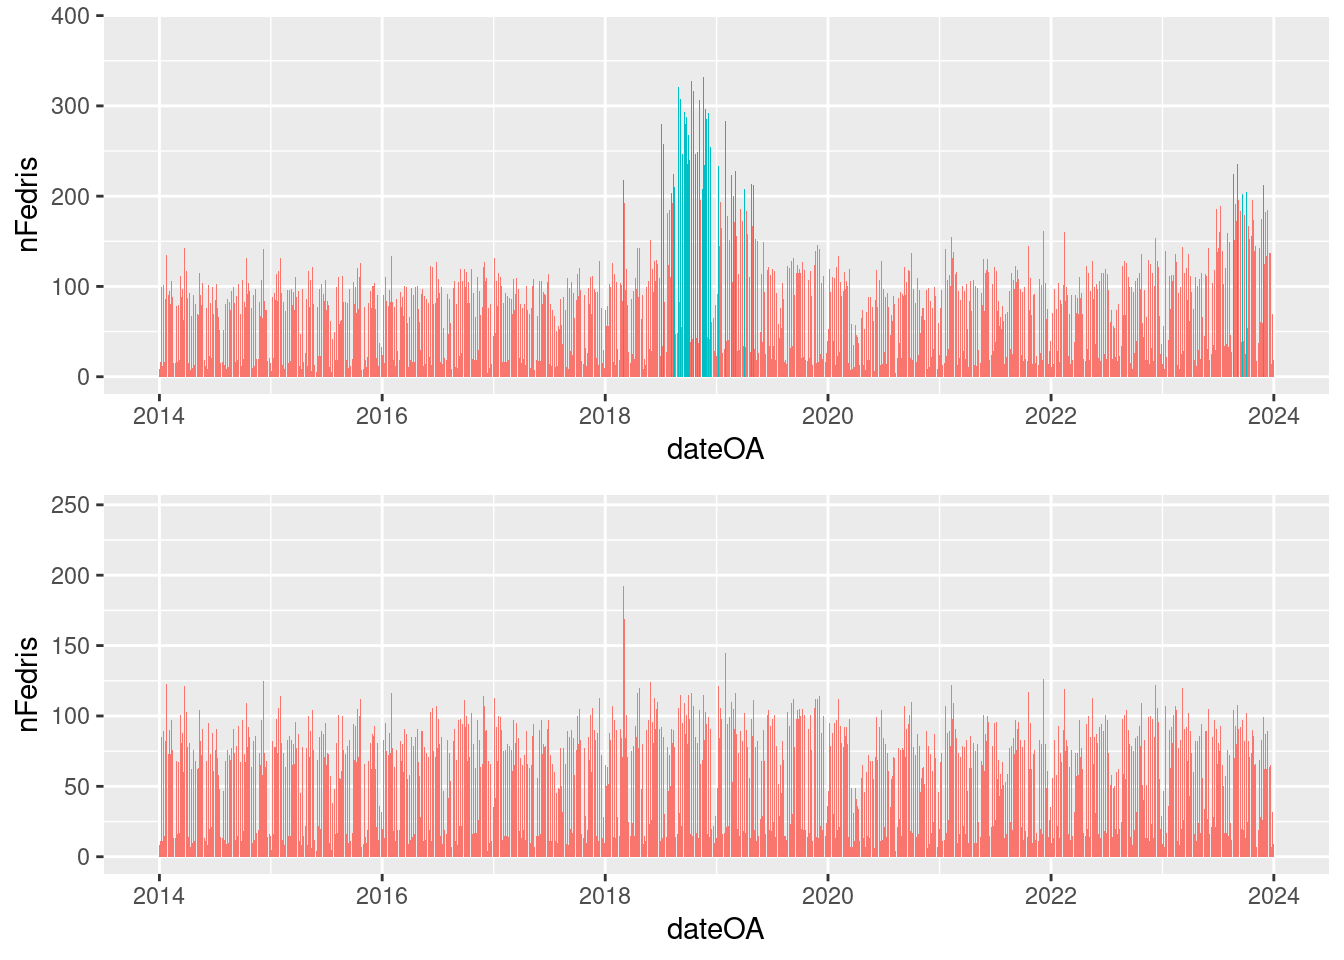
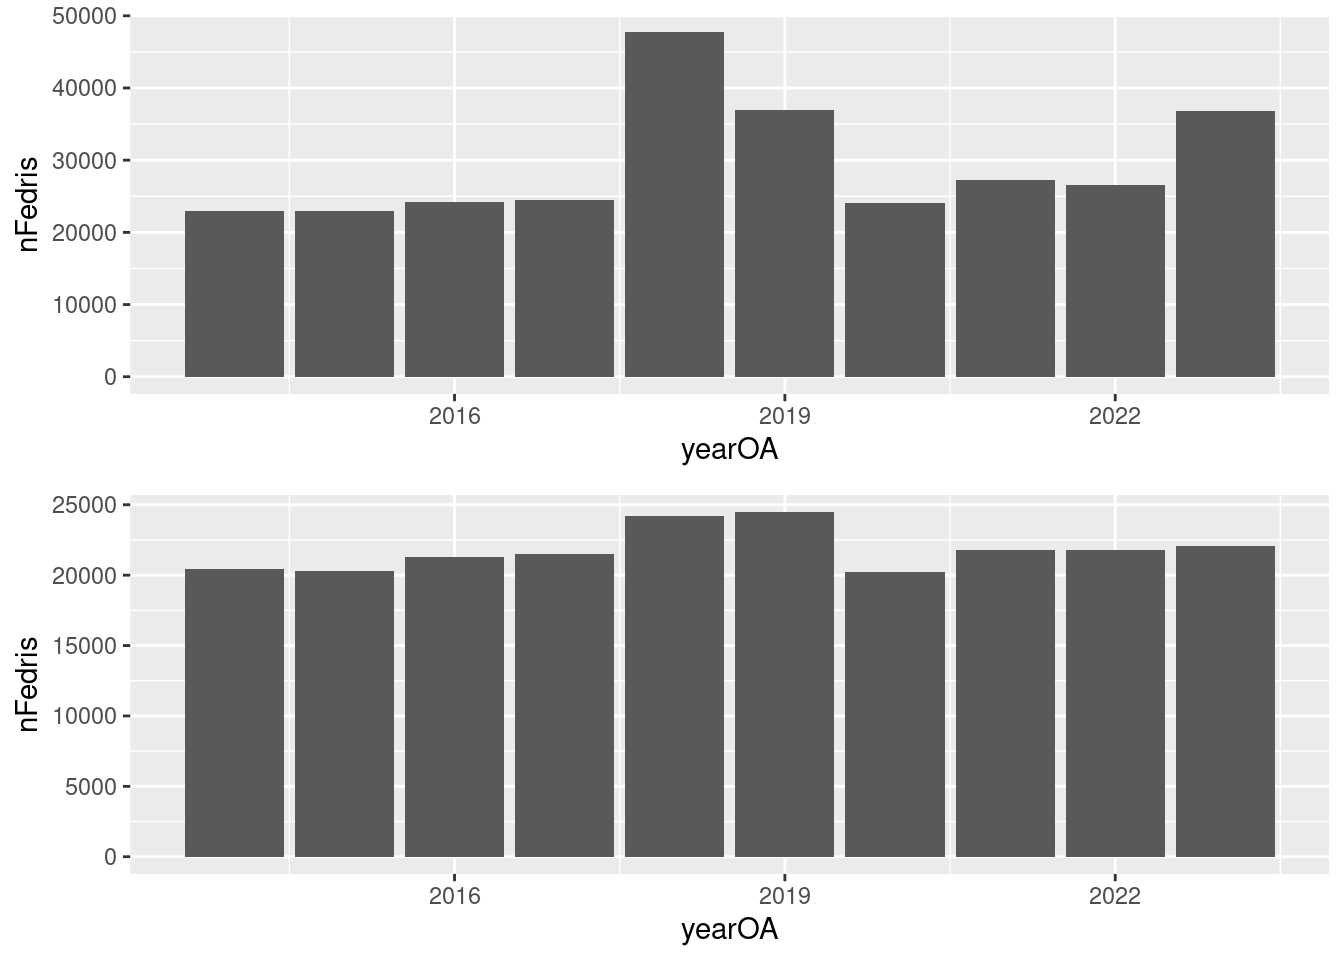
The same figure with unfiltered and filtered data (per year) is shown in Figure 2.12. Both figures clearly show the effects of the validation and filtering process.
Summary concerning potential duplications
- total number of notifications before validation: 293938
- total number of notifications with a unique OAF number: 162410
- total number of notifications within a duplicated OAF number: 131528
- total number of last notifications within a duplicated OAF number with a
STATUSthat is not NA: 56237 - total number of filtered notifications (without faonr duplicates): 218647
- total number of filtered notifications (without faonr duplicates) with a unique insznumber and dateOA combination: 217446
- total number of filtered notifications (without faonr duplicates) with a duplicated insznumber and dateOA combination: 1201
- total number of filtered last notifications (without faonr duplicates) with a duplicated insznumber and dateOA combination: 588
- total number of filtered notifications (without faonr duplicates and insznr/dateOA combination duplicates) after validation: 218034
Potential to use notifications as a proxy for occupational accidents
- Liantis ESPP received in the period of study from 2014 to 2023 -through OAF notification messages via KSZ- information on 293938 unique OAF records, which cannot all be considered as linked to unique occupational accidents
- After validation, in cooperation with FEDRIS, the number of unique OAF records was reduced to 218034 records; this last set of filtered records can be regarded as a validated set with information concerning unique occupational accidents
2.7 Data quality assessment of the validated FEDRIS notifications (antecedents)
In the next part of the data quality assessment we will focus on the other variables mentioned in Table 2.2 next to the identifier variables described higher.
2.7.1 Individual factors
Within KSZ, age (CAGEACC), date of birth (DATNAIS) and biological sex (SEX) are known FEDRIS variables. These variables are not present in the XML notifications as such, but can in many cases be calculated from the INSZ number, which is available in the notifications under the XML tag <ssin>.
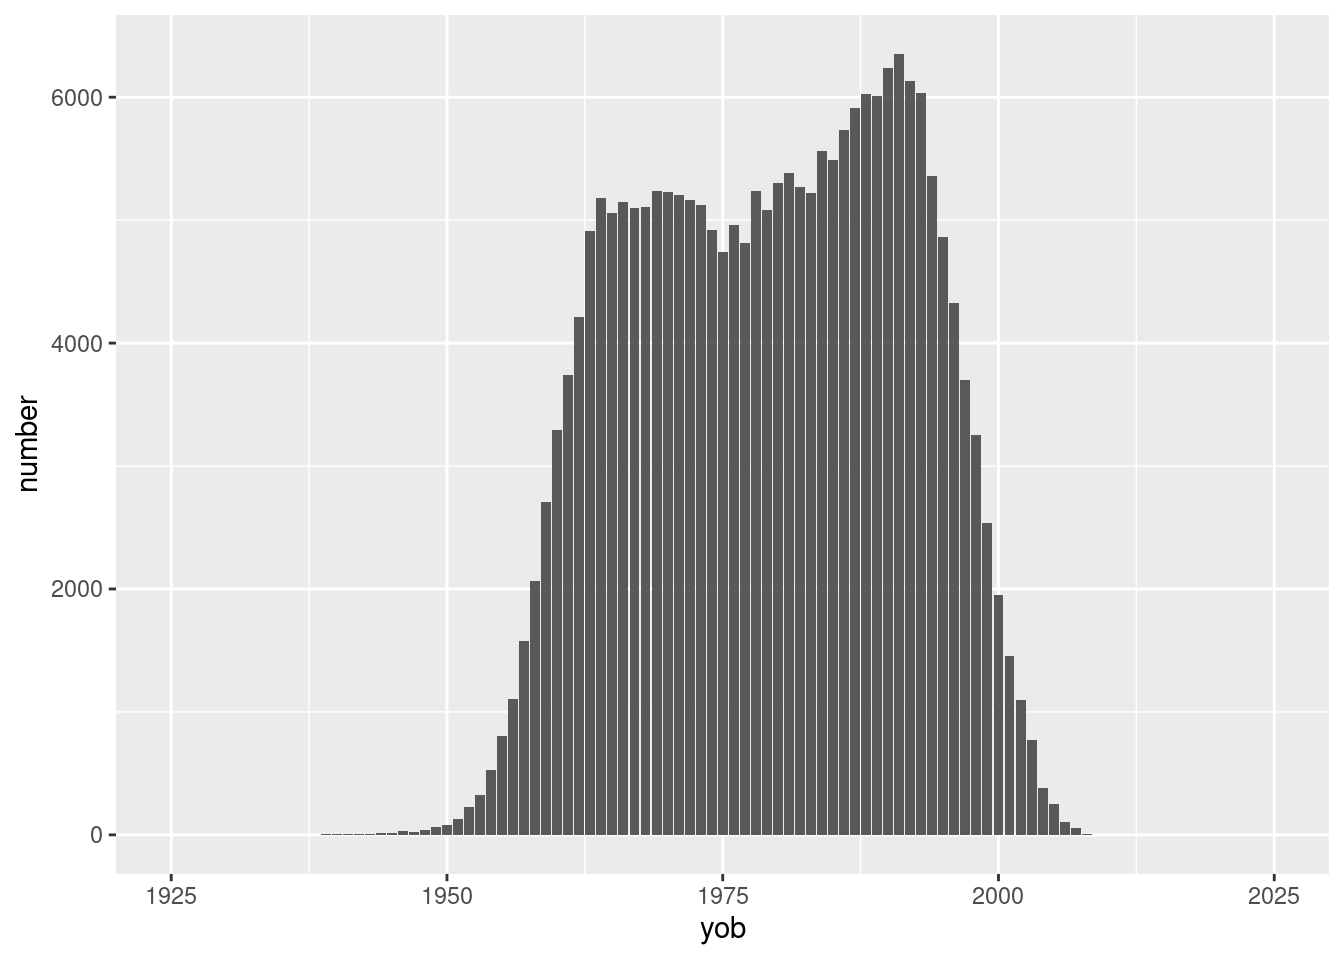
The distribution of all validated notifications by year of birth of the victim is shown in Figure 2.13. This year could in all cases be extracted from the INSZ number, however, in the case of BIS-registry numbers, the year of birth may be incorrect (see Table 2.19 for details).
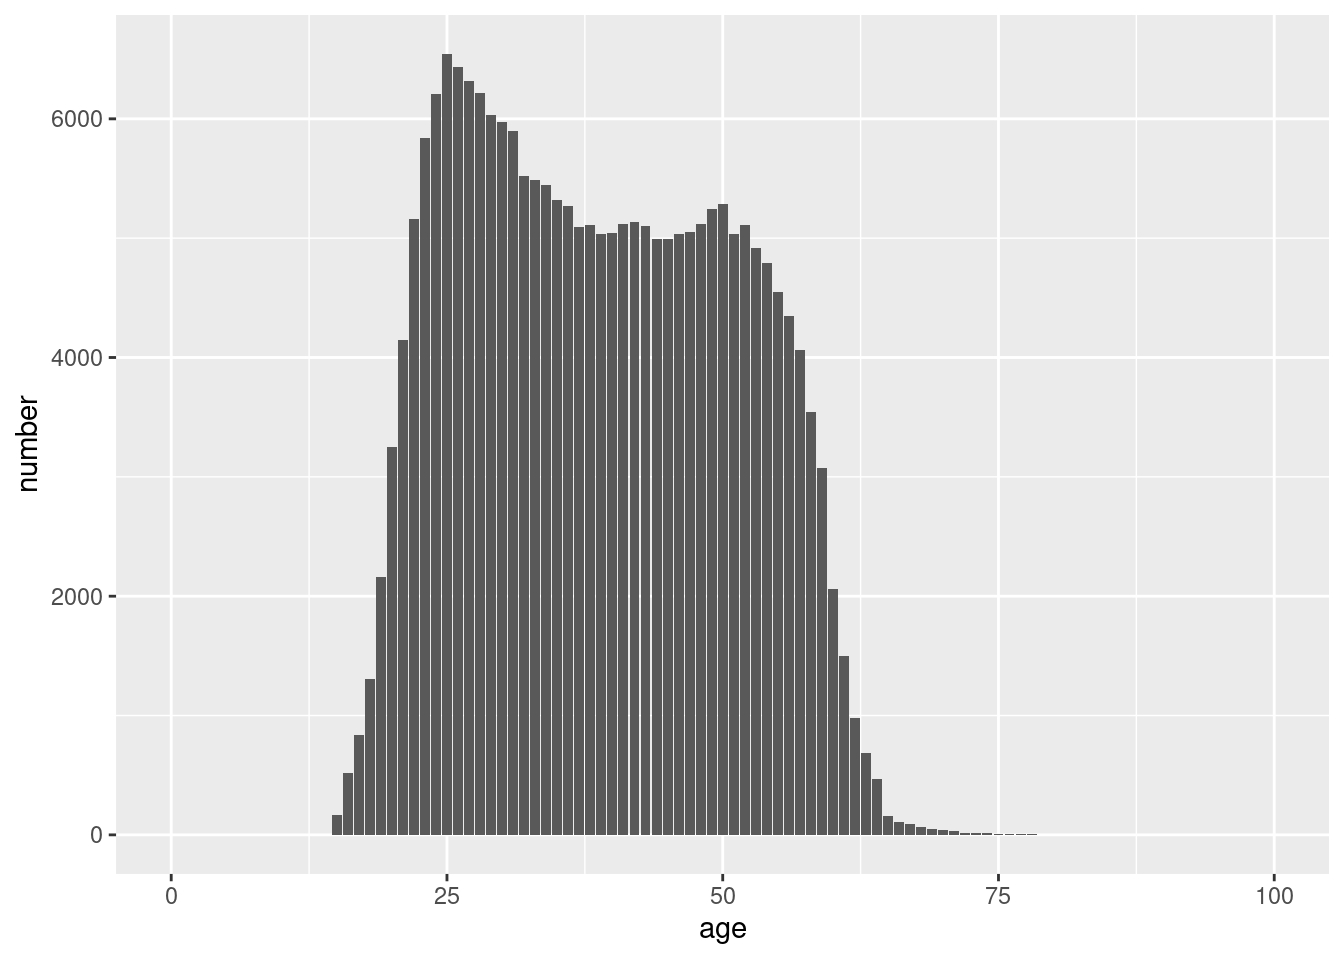
By subtracting the date of birth dtofb of the victim from the date of the OA dateOA and dividing the result by 365.25 (to account for leap years), the age of the victim at time of the accident can be calculated. Since dateOA is always available, this calculation can be made in all cases. Difficulties will arise in case of BIS-registry numbers (see Figure 2.14 and Table 2.19 for details).
The biological sex cannot be determined in a subset of BIS-registry numbers. Details are shown in Table 2.19.
| sex | bisnr | rnnr | percbisnr | percrnnr |
|---|---|---|---|---|
| F | 1170 | 75348 | 15.8 | 35.8 |
| M | 5737 | 135302 | 77.7 | 64.2 |
| NA | 477 | NA | 6.5 | NA |
Data Quality Alert: be carefull with BIS-registry numbers for deducting age and biological sex
- attention is needed when trying to recover age, birthdate and biological sex from an INSZ number: in 7384 (3.39%) notifications, the INSZ is not a “rijksregister” but a BIS-registry number, which introduces uncertainty
- a year of birth can be always extracted, but without any details on month and/or day, a date variable cannot be constructed, nor a time difference be calculated between date of the occupational accident and date of birth of the victim; this happens in 887 (12.01%) notifications with BIS-registry numbers;
- similar problems arise for sex: in 477 cases (6.46%), biological sex cannot be determined
Summary age and biological sex: the age distribution shows peaks around 25 and 50 years of age and about 7/10 victims of occupational accidents are male
- total number of validated notifications: 218034
- total number of validated notifications with a BIS-registry number: 7384 (3.39% of total)
- total number of validated notifications with missing age: 887 (0.41% of total and 12.01% of BIS-registry numbers)
- total number of validated notifications with missing biological sex: 477 (0.22% of total and 6.46% of BIS-registry numbers)
At KSZ, the seniority of the victim with the employer is known through the variable CANCV. This variable is available in the notifications under the XML tag <seniorityUsualProfessionCode>.
Details on the seniority of the victim are shown in Table 2.20. The number (n) and percentage (perc) of notifications by categories of seniority with the employer (catsenempmonth in months) are displayed. When needed, seniority can further be aggregated into broader categories like years (see Table 2.21).
| seniorityUsualProfessionCode | catsenempmonth | n | perc | percnotna |
|---|---|---|---|---|
| A | 0 | 7919 | 3.6 | 4.1 |
| B | 1 | 5227 | 2.4 | 2.7 |
| C | 2 | 4756 | 2.2 | 2.4 |
| D | 3 | 4226 | 1.9 | 2.2 |
| E | 4 | 3847 | 1.8 | 2.0 |
| F | 5 | 3636 | 1.7 | 1.9 |
| G | 6 | 3341 | 1.5 | 1.7 |
| H | 7 | 3150 | 1.4 | 1.6 |
| I | 8 | 3049 | 1.4 | 1.6 |
| J | 9 | 2994 | 1.4 | 1.5 |
| K | 10 | 2609 | 1.2 | 1.3 |
| L | 11 | 2553 | 1.2 | 1.3 |
| M | 12-23 | 24915 | 11.4 | 12.8 |
| N | 24-35 | 16245 | 7.5 | 8.4 |
| O | 36-47 | 12784 | 5.9 | 6.6 |
| P | 48-59 | 10206 | 4.7 | 5.2 |
| Q | 60-71 | 8516 | 3.9 | 4.4 |
| R | 72-83 | 7442 | 3.4 | 3.8 |
| S | 84-95 | 6461 | 3.0 | 3.3 |
| T | 96-107 | 5654 | 2.6 | 2.9 |
| U | 108-119 | 4934 | 2.3 | 2.5 |
| V | 120-131 | 4340 | 2.0 | 2.2 |
| W | 132-251 | 27874 | 12.8 | 14.3 |
| X | 252-371 | 11968 | 5.5 | 6.2 |
| Y | 372-719 | 5772 | 2.6 | 3.0 |
| NA | NA | 23616 | 10.8 | NA |
| catsenempyear | n | perc | percnotna |
|---|---|---|---|
| <1 | 47307 | 21.7 | 24.3 |
| >=1-<2 | 24915 | 11.4 | 12.8 |
| >=2-<3 | 16245 | 7.5 | 8.4 |
| >=3-<4 | 12784 | 5.9 | 6.6 |
| >=4-<5 | 10206 | 4.7 | 5.2 |
| >=5-<6 | 8516 | 3.9 | 4.4 |
| >=6-<7 | 7442 | 3.4 | 3.8 |
| >=7-<8 | 6461 | 3.0 | 3.3 |
| >=8-<9 | 5654 | 2.6 | 2.9 |
| >=9-<10 | 4934 | 2.3 | 2.5 |
| >=10-<11 | 4340 | 2.0 | 2.2 |
| >=11-<21 | 27874 | 12.8 | 14.3 |
| >=21-<31 | 11968 | 5.5 | 6.2 |
| >=31-<60 | 5772 | 2.6 | 3.0 |
| NA | 23616 | 10.8 | NA |
Data Quality Alert: seniority with the employer is often available
- in the notifications, seniorityUsualProfessionCode is sometimes missing; the “Z” value described in the corresponding KSZ variable CANCV with the label “Onbekend” is not present in any parsed record before or after filtering
- FEDRIS and/or KSZ could use the “Z” label as intended or remove it and treat the unkowns as “NA” (real missings, not available)
- the cuts and groupings in single months, single years and decades within a same variable is somewhat strange but allows to calculate new variables with categories at month, year or decade level (e.g. we will calculate a new variable with regrouping the seniority with the employer into years instead of months for easier interpretation)
Summary seniority with the employer: 1/4 has a seniority of <1 year (but 11% is missing)
- total number of validated notifications: 218034
- total number of validated notifications with missing seniority: 23616
- percentage of validated notifications with missing seniority: 10.83%
2.7.2 Job related factors
2.7.2.1 Duration of the contract (limited vs unlimited)
At KSZ, contracts of limited duration of the victim with the employer are known through the variable CDURCONTR. This variable is available in the notifications under the XML tag <limitedDurationContract>.
Details on the duration of the contract of the victim are shown in Table 2.22.
| contract_beperkte_duur | conlimdur | n | perc | percnotna |
|---|---|---|---|---|
| false | false | 166179 | 76.2 | 89.1 |
| true | true | 20225 | 9.3 | 10.9 |
| NA | NA | 31630 | 14.5 | NA |
Data Quality Alert: information on limited duration contracts is often available, but documentation could be improved
- KSZ has multiple pages for this same variable CDURCONTR, both for the same FEDRIS database scheme, and both being categorized as valid since 2017: CDURCONTR(-3) and CDURCONTR(-4) coexist under different themes, but only the latter provides information on the codes
- FEDRIS and/or KSZ could align on how to clean up and retain a single and harmonised variable definition
- although the values 0 and 1 are not present in the filtered set of notifications they did occur in the unfiltered set of notifications in the start-up period of the FARAO-batch process in 2012 and 2013 (data not shown); this could also be mentioned in the documentation
Summary limited duration contract with the employer: 1/10 is of limited duration (but 15% is missing)
- total number of validated notifications: 218034
- total number of validated notifications with missing information on limited duration contract: 31630
- percentage of validated notifications with missing information on limited duration contract: 14.51%
2.7.2.2 Nature of the contract (part-time vs full-time)
At KSZ, information on the nature of the victim’s contract within the employer is known through the variable NATCONTR. This variable is available in the notifications under the XML tag <fullTimeEmployment>.
Details on the nature of the contract of the victim are shown in Table 2.23.
| deeltijds_contract | catnatcon | n | perc | percnotna |
|---|---|---|---|---|
| false | voltijds | 132480 | 60.8 | 74.5 |
| true | deeltijds | 45258 | 20.8 | 25.5 |
| NA | NA | 40296 | 18.5 | NA |
It can be noted at this point that the duration of the contract and nature of the contract variables in the KSZ/FEDRIS system are stored separately, while the European Statistics on Accidents at Work (ESAW) system (European Statistics on Accidents at Work (ESAW), 2013) rather combines them into a single variable (see Figure 2.15).
Data Quality Alert: information on nature of the contracts is often available
- although the values 0 and 1 are not present in the filtered set of notifications, they did occur in the unfiltered set of notifications in the start-up period of the FARAO-batch process in 2012 and 2013 (data not shown)
- this could be mentioned in the documentation
Summary nature of the contract with the employer: 1/4 is a part-time contract (but 20% is missing)
- total number of validated notifications: 218034
- total number of validated notifications with missing information on nature of the contract: 40296
- percentage of validated notifications with missing information on nature of the contract: 18.48%
2.7.2.3 Category of NSSO employee code (blue vs white collar or others)
The employee sso code CONSS identifies the type of employee: white-collar workers, blue-collar workers, subsidised contract workers, artists, etc. The employee code, in combination with the employer code, determines which social security contributions the employer must pay to the NSSO. This variable seems to be available in the notifications under the XML tag <subjectionToNssoCategory>.
We will start with showing the raw data occurring under the <subjectionToNssoCategory> XML tag in all notifications in Table 2.24 beneath.
| 001 | 002 | 003 | 004 | 005 | 043 | 045 | 048 | 049 | 067 | 084 | 088 | 099 | 1 | 49 | 67 | 88 | 99 | NA | |
|---|---|---|---|---|---|---|---|---|---|---|---|---|---|---|---|---|---|---|---|
| 2014 | 14009 | 74 | 0 | 0 | 0 | 0 | 0 | 5 | 5798 | 278 | 0 | 55 | 202 | 1 | 0 | 0 | 1 | 0 | 0 |
| 2015 | 13543 | 64 | 0 | 0 | 0 | 0 | 0 | 11 | 5859 | 151 | 0 | 103 | 177 | 280 | 104 | 1 | 2 | 3 | 0 |
| 2016 | 14211 | 72 | 0 | 1 | 2 | 0 | 0 | 9 | 5860 | 115 | 0 | 833 | 182 | 0 | 0 | 0 | 0 | 0 | 0 |
| 2017 | 14372 | 77 | 0 | 1 | 1 | 0 | 0 | 14 | 5854 | 101 | 0 | 793 | 170 | 0 | 0 | 0 | 0 | 0 | 84 |
| 2018 | 14228 | 95 | 0 | 1 | 4 | 0 | 2 | 26 | 6086 | 146 | 0 | 877 | 183 | 0 | 0 | 0 | 0 | 0 | 2518 |
| 2019 | 14002 | 92 | 0 | 2 | 8 | 0 | 0 | 26 | 6301 | 166 | 0 | 827 | 210 | 0 | 0 | 0 | 0 | 0 | 2862 |
| 2020 | 11608 | 42 | 45 | 2 | 4 | 17 | 0 | 9 | 5186 | 73 | 112 | 694 | 135 | 0 | 0 | 0 | 0 | 0 | 2277 |
| 2021 | 12452 | 63 | 96 | 2 | 5 | 32 | 2 | 12 | 5846 | 87 | 149 | 763 | 133 | 0 | 0 | 0 | 0 | 0 | 2169 |
| 2022 | 12589 | 49 | 134 | 2 | 11 | 52 | 0 | 9 | 5560 | 46 | 195 | 897 | 165 | 0 | 0 | 0 | 0 | 0 | 2110 |
| 2023 | 12470 | 71 | 251 | 2 | 23 | 63 | 5 | 3 | 5837 | 24 | 230 | 820 | 144 | 0 | 0 | 0 | 0 | 0 | 2122 |
When we compare Table 2.24 with the KSZ documentation on the CONSS variable, we can clearly notice that the values in the notifications are not in line with the KSZ documentation (see Figure 2.16). Some values have leading zero’s other haven’t.
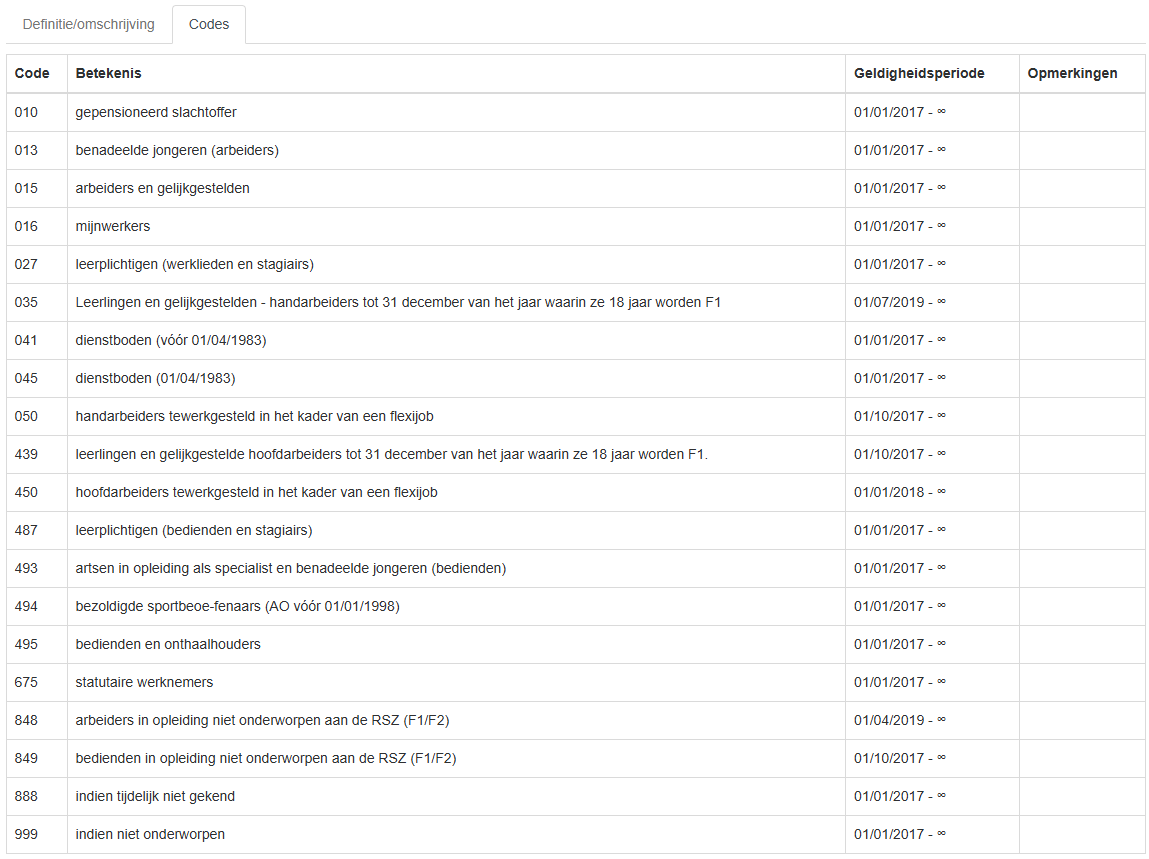
We will try to recode the values in the notifications under the assumption that a four character code with padding zero’s is available at some stage in the FEDRIS database, but only the first three characters are passed through the XML batch variable and the KSZ documentation only retains the last three characters. Additionally, we will label notifications with a missing value for the CONSS but retrieved by faonr in the tables for the public sector in the FEDRIS validation set as “civil servants” (ambtenaren).
Details on the recoded catnsso variable are shown in Table 2.25.
| catnsso | n | perc | percnotna |
|---|---|---|---|
| 010 gepensioneerd slachtoffer | 013 benadeelde jongeren (arbeiders) | 015 arbeiders en gelijkgestelden | 016 mijnwerkers | 133765 | 61.4 | 61.4 |
| 027 leerplichtigen (werklieden en stagiairs) | 699 | 0.3 | 0.3 |
| 035 leerlingen en gelijkgestelden - handarbeiders tot 31 december van het jaar waarin ze 18 jaar worden F1 | 526 | 0.2 | 0.2 |
| 041 dienstboden (vóór 01/04/1983) | 045 dienstboden (01/04/1983) | 13 | 0.0 | 0.0 |
| 050 handarbeiders tewerkgesteld in het kader van een flexijob | 58 | 0.0 | 0.0 |
| 439 leerlingen en gelijkgestelden - hoofdarbeiders tot 31 december van het jaar waarin ze 18 jaar worden F1 | 164 | 0.1 | 0.1 |
| 450 hoofdarbeiders tewerkgesteld in het kader van een flexijob | 9 | 0.0 | 0.0 |
| 487 leerplichtigen (bedienden en stagiairs) | 124 | 0.1 | 0.1 |
| 493 artsen in opleiding als specialist en benadeelde jongeren (bedienden) | 494 bezoldigde sportbeoefenaars (AO vóór 01/01/1998) | 495 bedienden en onthaalhouders | 58291 | 26.7 | 26.7 |
| 848 arbeiders in opleiding niet onderworpen aan de RSZ (F1/F2) | 849 bedienden in opleiding niet onderworpen aan de RSZ (F1/F2) | 686 | 0.3 | 0.3 |
| ambtenaar | 14090 | 6.5 | 6.5 |
| indien niet onderworpen | 1704 | 0.8 | 0.8 |
| indien tijdelijk niet gekend | 6665 | 3.1 | 3.1 |
| statutaire werknemers | 1188 | 0.5 | 0.5 |
| NA | 52 | 0.0 | NA |
Data Quality Alert: information on the NSSO category is higly unreliable and should be confirmed
- there is a large mismatch between the values in the notifications and the KSZ documentation
- KSZ has multiple pages online for the CONSS but nor the currently valid CONSS(-2) nor the expired definitions (CONSS(-0) and CONSS(-3)) match the codes retrieved from the data
- FEDRIS and/or KSZ could clean up the CONSS definitions to retain a single and harmonised variable definition and provide clarity on the content of the
<subjectionToNssoCategory>XML tag in the FARAO-batch contents - labelling notifications with a missing value for the CONSS variable but retrieved by faonr in the tables for the public sector in the FEDRIS validation set as “civil servants” (ambtenaren) is an assumption we made
2.7.2.4 Subcontracting
Whether the victim is employed as a subcontractor is at KSZ known under the variable SOUSTRAIT. This variable is available in the notifications under the XML tag <subcontracting>.
Details on the recoded catsubcontr variable are shown in Table 2.26.
| subcontract | catsubcontr | n | perc | percnotna |
|---|---|---|---|---|
| false | false | 173381 | 79.5 | 100 |
| true | true | 81 | 0.0 | 0 |
| NA | NA | 44572 | 20.4 | NA |
Data Quality Alert: the data shown alsmost no positive validation of subcontracting
- data shows that less than 100 notifications have a “true” value under subcontracting status in 2014 and 2015; from 2016 onwards, no positives are found; this is highly unlikely (Moon, 2022)
- FEDRIS and/or KSZ could provide clarity why almost 100% cases have the value “false”
- a variable without variation is not useful to provide and could be removed from the notifications
Summary on the subcontracting category: notifications do not show any subcontracting (and 20% is missing)
- total number of validated notifications: 218034
- total number of validated notifications with missing information on subcontracting: 44572
- total number of validated notifications with a positive value for subcontracting: 81
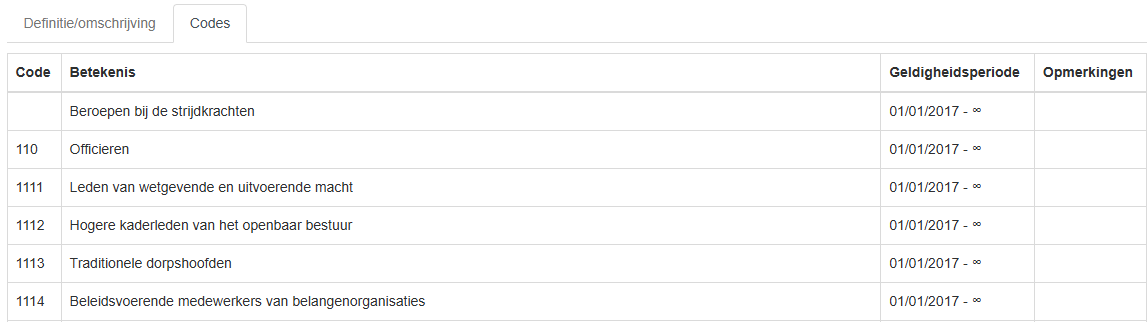
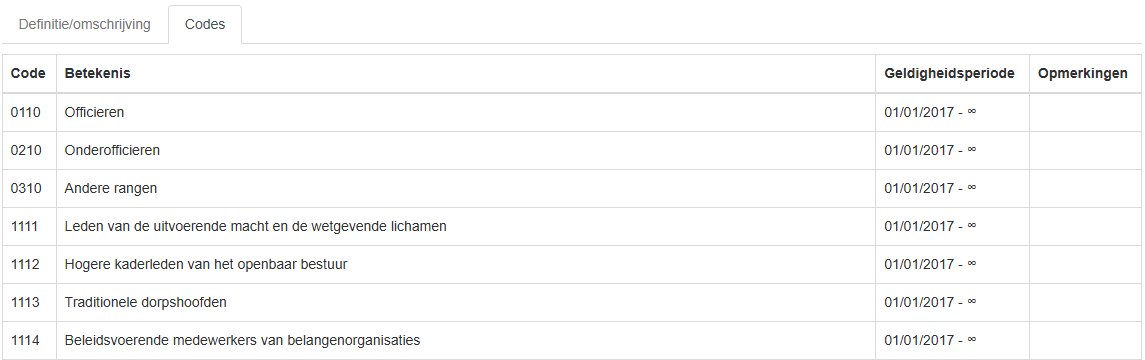
2.7.2.5 Professional category of the victim
KSZ categorises the profession of the victim in the variables CATPROFVICT(-2) or CATPROFVICT(-5), both being valid until today from 2017 respectively 2014 onward. While the CATPROFVICT(-5) variable only contains the labels A-P, the CATPROFVICT(-2) version includes two additional categories (X and Y). Data on this variable is available in the notifications under the XML tag <professionalCategory>.
We begin by presenting the raw data found under the <professionalCategory> XML tag across all notifications, as shown in Table 2.27. The table clearly reveals the presence of undefined labels (Q to W and Z). In a personal communication with the FEDRIS statistics team on May 22, 2025, it was confirmed that these categories do exist, their meanings are known, and they are specifically reserved for use within the public sector.
| A | B | C | D | E | F | G | H | I | J | O | P | Q | R | S | T | U | V | W | X | Y | Z | |
|---|---|---|---|---|---|---|---|---|---|---|---|---|---|---|---|---|---|---|---|---|---|---|
| 2014 | 14110 | 4529 | 290 | 1276 | 105 | 0 | 2 | 8 | 0 | 101 | 2 | 0 | 0 | 0 | 0 | 0 | 0 | 0 | 0 | 0 | 0 | 0 |
| 2015 | 13815 | 4767 | 344 | 1147 | 109 | 0 | 2 | 22 | 0 | 88 | 0 | 4 | 0 | 0 | 0 | 0 | 0 | 0 | 0 | 0 | 0 | 0 |
| 2016 | 14520 | 5170 | 308 | 1056 | 123 | 0 | 0 | 20 | 0 | 87 | 0 | 1 | 0 | 0 | 0 | 0 | 0 | 0 | 0 | 0 | 0 | 0 |
| 2017 | 14664 | 5036 | 407 | 1051 | 134 | 1 | 0 | 17 | 1 | 68 | 0 | 4 | 31 | 27 | 12 | 0 | 14 | 0 | 0 | 0 | 0 | 0 |
| 2018 | 14525 | 5443 | 405 | 1016 | 162 | 0 | 1 | 16 | 0 | 78 | 0 | 2 | 723 | 744 | 677 | 3 | 371 | 0 | 0 | 0 | 0 | 0 |
| 2019 | 14231 | 5594 | 472 | 1033 | 159 | 1 | 0 | 30 | 5 | 99 | 0 | 10 | 837 | 840 | 832 | 2 | 351 | 0 | 0 | 0 | 0 | 0 |
| 2020 | 11845 | 4504 | 420 | 843 | 98 | 0 | 1 | 19 | 0 | 70 | 0 | 2 | 680 | 714 | 635 | 0 | 238 | 8 | 2 | 97 | 28 | 0 |
| 2021 | 12899 | 5057 | 332 | 979 | 104 | 1 | 0 | 13 | 0 | 78 | 0 | 0 | 597 | 672 | 659 | 2 | 230 | 8 | 1 | 112 | 67 | 0 |
| 2022 | 13064 | 4998 | 362 | 847 | 120 | 1 | 0 | 23 | 0 | 95 | 0 | 0 | 615 | 642 | 678 | 3 | 167 | 5 | 0 | 75 | 124 | 0 |
| 2023 | 13040 | 5180 | 406 | 819 | 124 | 0 | 0 | 23 | 2 | 102 | 0 | 0 | 614 | 696 | 666 | 4 | 140 | 2 | 0 | 84 | 159 | 4 |
Details on the recoded catprof variable are shown in Table 2.28.
| beroepscategorie | catprof | n | perc | percnotna |
|---|---|---|---|---|
| A | Arbeider | 136713 | 62.7 | 62.7 |
| B | Administratieve bedienden | 50278 | 23.1 | 23.1 |
| C | Arbeider met een bediendestatuut | 3746 | 1.7 | 1.7 |
| D | Overige bedienden | 10067 | 4.6 | 4.6 |
| E | Uitbreiding wet | 1238 | 0.6 | 0.6 |
| F | Huispersoneel onderworpen SZ | 4 | 0.0 | 0.0 |
| G | Huispersoneel niet onderworpen SZ | 6 | 0.0 | 0.0 |
| H | Uitzendkrachten arbeiders | 191 | 0.1 | 0.1 |
| I | Uitzendkrachten bedienden | 8 | 0.0 | 0.0 |
| J | Andere Wet 1971 | 866 | 0.4 | 0.4 |
| O | Uitzendkrachten studenten | 2 | 0.0 | 0.0 |
| P | Onbetaalde stagiairs | 23 | 0.0 | 0.0 |
| Q | Onbekend 1 | 4097 | 1.9 | 1.9 |
| R | Onbekend 2 | 4335 | 2.0 | 2.0 |
| S | Onbekend 3 | 4159 | 1.9 | 1.9 |
| T | Onbekend 4 | 14 | 0.0 | 0.0 |
| U | Onbekend 5 | 1511 | 0.7 | 0.7 |
| V | Onbekend 6 | 23 | 0.0 | 0.0 |
| W | Onbekend 7 | 3 | 0.0 | 0.0 |
| X | Stagiaire kleine statuten F1 | 368 | 0.2 | 0.2 |
| Y | Stagiaire kleine statuten F2 | 378 | 0.2 | 0.2 |
| Z | Onbekend 8 | 4 | 0.0 | 0.0 |
Data Quality Alert: many undefined values in the professional category variable
- there is a mismatch between the values in the notifications and the KSZ documentation (undefined labels for the values Q to W and Z)
- KSZ has multiple pages (6 pages) online for the CATPROFVICT, neither the currently valid CATPROFVICT(-2) and currently valid CATPROFVICT(-5) or the invalid CATPROFVICT, CATPROFVICT(-1), CATPROFVICT(-3) and CATPROFVICT(-4) match the codes found in the data
- FEDRIS and/or KSZ could clean up the CATPROFVICT definitions to retain a single and harmonised variable definition and provide clarity on the content of the
<professionalCategory>XML tag FARAO-batch content
Potential risks for stakeholders
Based on the information provided in Table 2.27, it can be inferred that changes in the labelling of the victim’s professional category occurred at least in 2017 and 2020. However, it remains unclear to the authors how stakeholders are currently informed about such changes. When a notification variable is business-critical for one or more stakeholders, it is essential to have a well-defined process in place to communicate any modifications to its labelling. The authors recommend that FEDRIS and/or KSZ ensure that, if such a process exists, it is clearly communicated to all relevant stakeholders. If no such process is currently in place, one should be developed and formally communicated.
Summary professional category: always present, not always defined (0% is missing but 6.5% is undefined)
- total number of validated notifications: 218034
- total number of validated notifications with missing information on professional category: 0
- total number of validated notifications with an unkown value for professional category: 14146
- percentage of validated notifications with an unknown value for professional category: 6.5%
2.7.2.6 Function category (International Standard Classification of Occupations (ISCO)-08 category) of the victim
KSZ labels the function of the victim by means of the ISCO-08 system. The information is stored in the the variables CITP08, CITP and CITP_08. A comparison of the KSZ documentation for the first and last variable is shown in Figure 2.17 and illustrates a potential leading zero problem in the first two. The ISCO-08 function category is available in the notifications under the XML tag <functionCode>.
Details on the recoded catisco08en variable are shown in Table 2.29. The top and tail as well as the “NA” frequencies are shown.
| functiecode | catisco08en | n | perc | percnotna |
|---|---|---|---|---|
| NA | NA | 185243 | 85.0 | NA |
| 5321 | Health care assistants | 1487 | 0.7 | 4.5 |
| 9629 | Elementary workers not elsewhere classified | 1333 | 0.6 | 4.1 |
| 3221 | Nursing associate professionals | 1330 | 0.6 | 4.1 |
| 8332 | Heavy truck and lorry drivers | 1287 | 0.6 | 3.9 |
| 7111 | House builders | 1229 | 0.6 | 3.7 |
| 9111 | Domestic cleaners and helpers | 1050 | 0.5 | 3.2 |
| 5412 | Police officers | 1 | 0.0 | 0.0 |
| 7314 | Potters and related workers | 1 | 0.0 | 0.0 |
| 7516 | Tobacco preparers and tobacco products makers | 1 | 0.0 | 0.0 |
| 7531 | Tailors, dressmakers, furriers and hatters | 1 | 0.0 | 0.0 |
| 8156 | Shoemaking and related machine operators | 1 | 0.0 | 0.0 |
| 9624 | Water and firewood collectors | 1 | 0.0 | 0.0 |
Although Figure 2.17 highlights a potential risk, the non-missing values in the dataset all consist of four characters (data not shown). However, a notable issue with missing ISCO-08 codes emerges from september/october 2015 (data not shown) and results in the absence of any information concerning ISCO-08 codes in the notifications between 2016 and 2023 as shown in Table 2.30.
| FALSE | TRUE | |
|---|---|---|
| 2014 | 18751 | 1672 |
| 2015 | 14040 | 6258 |
| 2016 | 0 | 21285 |
| 2017 | 0 | 21467 |
| 2018 | 0 | 24166 |
| 2019 | 0 | 24496 |
| 2020 | 0 | 20204 |
| 2021 | 0 | 21811 |
| 2022 | 0 | 21819 |
| 2023 | 0 | 22065 |
If we inspect the source XMLs, we can conclude that the missings are not originating from “NA” values, but from the fact that the <functionCode> tag is absent from the XMLs. This is illustrated in Figure 2.18 (b).
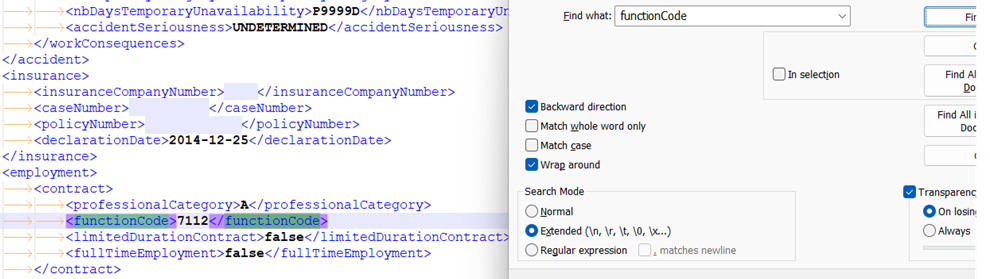
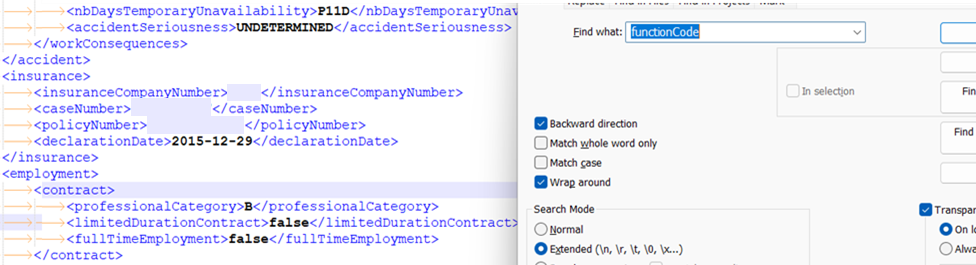
<functionCode> tag in the XMLs (before/after september 2015)
Data Quality Alert: many missings on an ambiguously documented ISCO-08 variable
- KSZ has multiple pages online for the ISCO-08 system; the CITP_08 seems to be the correct one with the leading zero’s included
- KSZ could remove the redundant documentation pages and retain only the correct one
- more than 80% of values is missing from september/october 2015 onward; it is not clear why the
<functionCode>XML tag is suddenly missing from the source files
Summary on the ISCO-08 category: notifications do not contain relevant information between end 2015 and 2023 (85% is missing)
2.7.2.7 Long working hours (duration of the shift)
Information concerning the working hours on the day of the accident is stored in the variables HRNORDEBACC and HRNORFINACC, the latter being wrongly identified as ‘HRNORDEBACC’ as well (Figure 2.19). These variables are available in the notifications under the XML tags <startHour> and <endHour>.
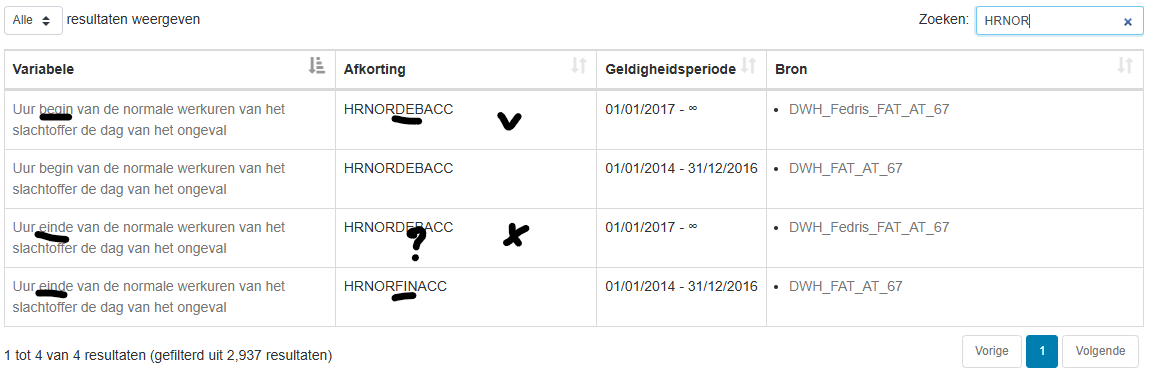
The length of the shift can be calculated by subtracting the start hour from the end hour. However, the end hour can be smaller than the start hour, indicating that the shift ends the next day. This is corrected by adding 24 hours to the end hour if it is smaller than the start hour. The same logic is applied to the lunch break, which is stored in the variables HRPAUSDEB and HRPAUSFIN.
The distribution of the length of the work shift the day of the accident can be calculated for 141317 (64.8%) notifications and is shown in the following Figure 2.20.
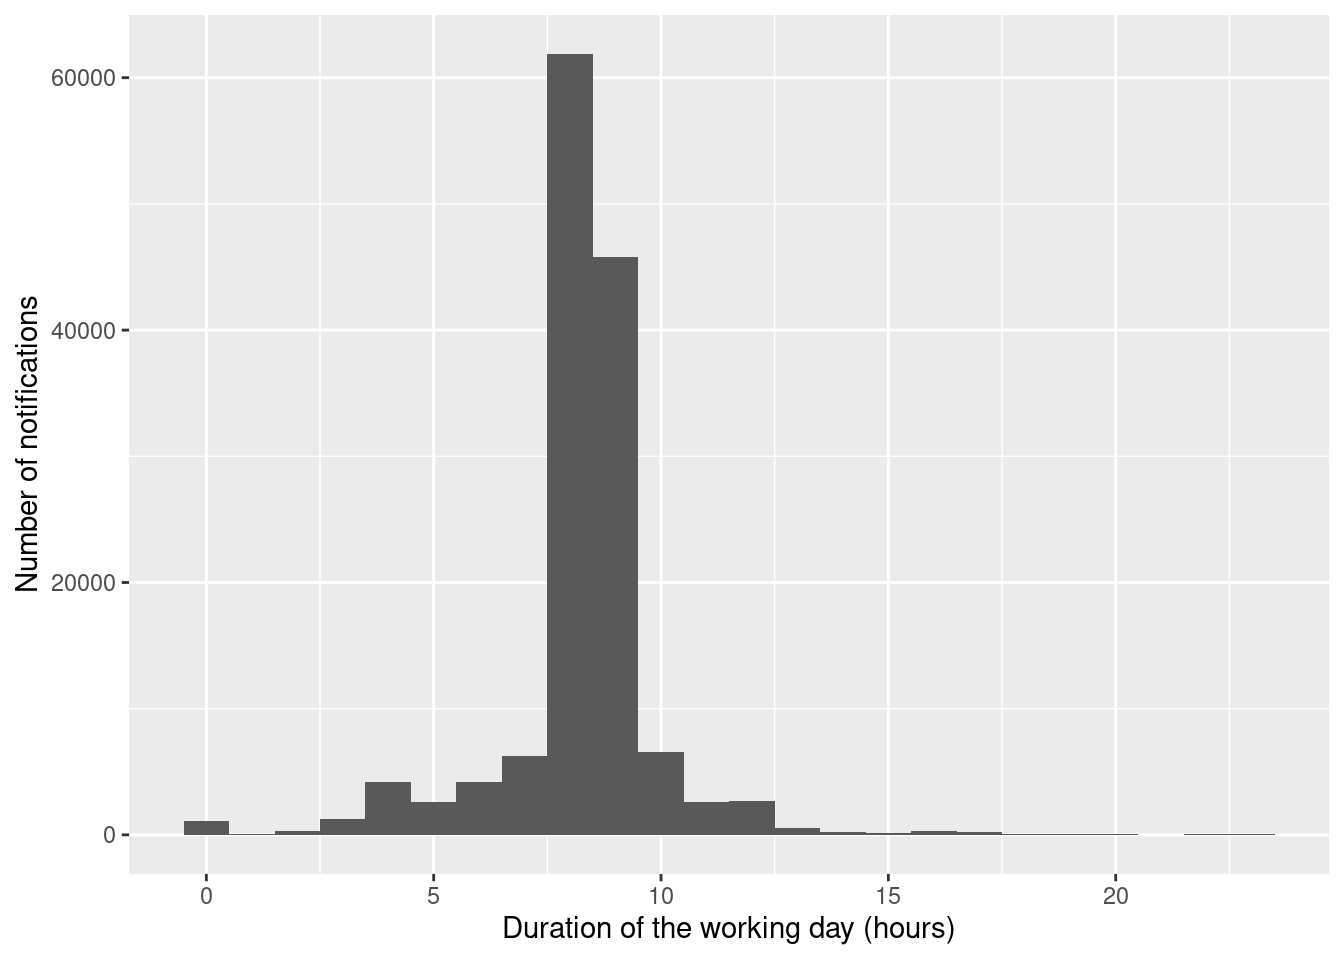
The distribution of the length of the lunch break the day of the accident can be calculated for 100053 (45.9%) notifications and is shown in the following Figure 2.21.
Details on calculated length of the workday and lunch break the day of the accident are shown in Table 2.31. It is clear that the duration of the lunch break is often missing and that the quality of our result for this calculation is doubtful.
| Hours | nDay | percDay | percnotnaDay | nLunch | percLunch | percnotnaLunch |
|---|---|---|---|---|---|---|
| 0 | 1128 | 0.5 | 0.8 | 61107 | 28.0 | 61.1 |
| 1 | 81 | 0.0 | 0.1 | 33441 | 15.3 | 33.4 |
| 2 | 304 | 0.1 | 0.2 | 1260 | 0.6 | 1.3 |
| 3 | 1249 | 0.6 | 0.9 | 787 | 0.4 | 0.8 |
| 4 | 4154 | 1.9 | 2.9 | 855 | 0.4 | 0.9 |
| 5 | 2608 | 1.2 | 1.8 | 313 | 0.1 | 0.3 |
| 6 | 4180 | 1.9 | 3.0 | 190 | 0.1 | 0.2 |
| 7 | 6283 | 2.9 | 4.4 | 167 | 0.1 | 0.2 |
| 8 | 61905 | 28.4 | 43.8 | 159 | 0.1 | 0.2 |
| 9 | 45816 | 21.0 | 32.4 | 61 | 0.0 | 0.1 |
| 10 | 6540 | 3.0 | 4.6 | 69 | 0.0 | 0.1 |
| 11 | 2592 | 1.2 | 1.8 | 90 | 0.0 | 0.1 |
| 12 | 2689 | 1.2 | 1.9 | 247 | 0.1 | 0.2 |
| 13 | 563 | 0.3 | 0.4 | 91 | 0.0 | 0.1 |
| 14 | 250 | 0.1 | 0.2 | 73 | 0.0 | 0.1 |
| 15 | 160 | 0.1 | 0.1 | 37 | 0.0 | 0.0 |
| 16 | 338 | 0.2 | 0.2 | 198 | 0.1 | 0.2 |
| 17 | 199 | 0.1 | 0.1 | 48 | 0.0 | 0.0 |
| 18 | 96 | 0.0 | 0.1 | 65 | 0.0 | 0.1 |
| 19 | 49 | 0.0 | 0.0 | 167 | 0.1 | 0.2 |
| 20 | 38 | 0.0 | 0.0 | 340 | 0.2 | 0.3 |
| 21 | 26 | 0.0 | 0.0 | 209 | 0.1 | 0.2 |
| 22 | 34 | 0.0 | 0.0 | 47 | 0.0 | 0.0 |
| 23 | 35 | 0.0 | 0.0 | 32 | 0.0 | 0.0 |
| NA | 76717 | 35.2 | NA | 117981 | 54.1 | NA |
Data Quality Alert: start and end hours are often available for the workday (2/3), but not for the lunch break (1/5)
- In the documentation, KSZ could correct the variable name of the end of the workday to HRNORFINACC in stead of HRNORDEBACC which is already used for the beginning of the workday
- If the original declarations of the insurers contain information on the start and end of the workday with a resolution of minutes, the minutes could be reported in the variables as well; this would yield more variation and information
- If it is not possible or feasible to report mm and/or ss, the mm:ss part of the hh:mm:ss values is not informative and could be discarded
- From the little peak for a 0 h duration in Figure 2.20 we learn that in a small fraction of cases the end hour equals the start hour; in 1019 cases (90.34%) this is twice the value 00:00:00, in 109 cases (9.66%) two other equal hours are noticed; we cannot make the difference between actual 24h shifts or data quality issues in this case
- Calculations with time differences are difficult; if the date part is missing from the start and end hours, assumptions have to be made when end hours appear to be lower than start hours; this could be improved by using a datetime format with an appropriate resolution
Summary on the duration of the shift: 75% have a duration of 8 or 9 hours (but 20% is missing, and for the lunch break even 80% is missing)
- total number of validated notifications: 218034
- total number of validated notifications with missing information on start of the workday: 53519
- total number of validated notifications with missing information on end of the workday: 76545
- total number of validated notifications with missing information on duration of the workday: 76717
- percentage of validated notifications with missing information on the duration of the workday: 35.19%
- total number of validated notifications with missing information on start of the lunch break: 95196
- total number of validated notifications with missing information on end of the lunch break: 117467
- total number of validated notifications with missing information on duration of the lunch break: 117981
- percentage of validated notifications with missing information on the duration of the lunch break: 54.11%
2.7.2.8 Specific activity
KSZ also tracks information on the nature of the work, the task (activity) of the victim at the time of the accident. It is not about the profession of the victim but about his specific activity at the time of the accident. It is a description of the type of work, the task in the broad sense, performed for a certain time up to the time of the accident. This information is stored in the variable TYPETRAV and is passed through via the notifications under the XML tag <workCategory>. KSZ states that the specific activity will not be available if the OA has been the subject of a simplified declaration (electronic declaration of OA that give rise to less than 4 days of temporary incapacity). In the documentation is clarified that the value “0” is used for “no information” (Figure 2.22).

The data from the notifications however learns that the specific activity is almost exclusively coded with a two digit number: the “0” value is only present in 21 cases in 2015 (Table 2.32).
| 0 | 00 | 10 | 11 | |
|---|---|---|---|---|
| 2014 | 0 | 1377 | 1029 | 2668 |
| 2015 | 21 | 1520 | 1131 | 2389 |
| 2016 | 0 | 1605 | 1328 | 2559 |
| 2017 | 0 | 1773 | 1337 | 2757 |
| 2018 | 0 | 1788 | 1232 | 2749 |
| 2019 | 0 | 1709 | 1033 | 2727 |
| 2020 | 0 | 1329 | 657 | 2584 |
| 2021 | 0 | 1771 | 679 | 2718 |
| 2022 | 0 | 1423 | 862 | 2670 |
| 2023 | 0 | 1910 | 936 | 2560 |
We assume this is a coding error and recode the “0” value to “00” in the data. The specific activity is then recoded to a factor with 35 levels.
Details on the specific activity of the victim the day of the accident are shown in Table 2.33.
| catspecact | n | perc | percnotna |
|---|---|---|---|
| 00 | 16226 | 7.4 | 7.7 |
| 10 | 10224 | 4.7 | 4.9 |
| 11 | 26381 | 12.1 | 12.6 |
| 12 | 9727 | 4.5 | 4.6 |
| 19 | 1849 | 0.8 | 0.9 |
| 20 | 1798 | 0.8 | 0.9 |
| 21 | 579 | 0.3 | 0.3 |
| 22 | 5914 | 2.7 | 2.8 |
| 23 | 920 | 0.4 | 0.4 |
| 24 | 7136 | 3.3 | 3.4 |
| 25 | 448 | 0.2 | 0.2 |
| 29 | 1013 | 0.5 | 0.5 |
| 30 | 905 | 0.4 | 0.4 |
| 31 | 178 | 0.1 | 0.1 |
| 32 | 1469 | 0.7 | 0.7 |
| 33 | 467 | 0.2 | 0.2 |
| 34 | 260 | 0.1 | 0.1 |
| 35 | 52 | 0.0 | 0.0 |
| 39 | 437 | 0.2 | 0.2 |
| 40 | 4902 | 2.2 | 2.3 |
| 41 | 33924 | 15.6 | 16.2 |
| 42 | 5468 | 2.5 | 2.6 |
| 43 | 7088 | 3.3 | 3.4 |
| 49 | 1488 | 0.7 | 0.7 |
| 50 | 621 | 0.3 | 0.3 |
| 51 | 15054 | 6.9 | 7.2 |
| 52 | 7916 | 3.6 | 3.8 |
| 53 | 9262 | 4.2 | 4.4 |
| 54 | 2331 | 1.1 | 1.1 |
| 55 | 1740 | 0.8 | 0.8 |
| 59 | 1070 | 0.5 | 0.5 |
| 60 | 879 | 0.4 | 0.4 |
| 61 | 20134 | 9.2 | 9.6 |
| 62 | 2079 | 1.0 | 1.0 |
| 69 | 206 | 0.1 | 0.1 |
| 99 | 9599 | 4.4 | 4.6 |
| NA | 8290 | 3.8 | NA |
We also wanted to note that the specific activity variable present in the KSZ does not seem to match the specific physical activity from (European Statistics on Accidents at Work (ESAW), 2013), but rather the working process variable. This is shown in Figure 2.23
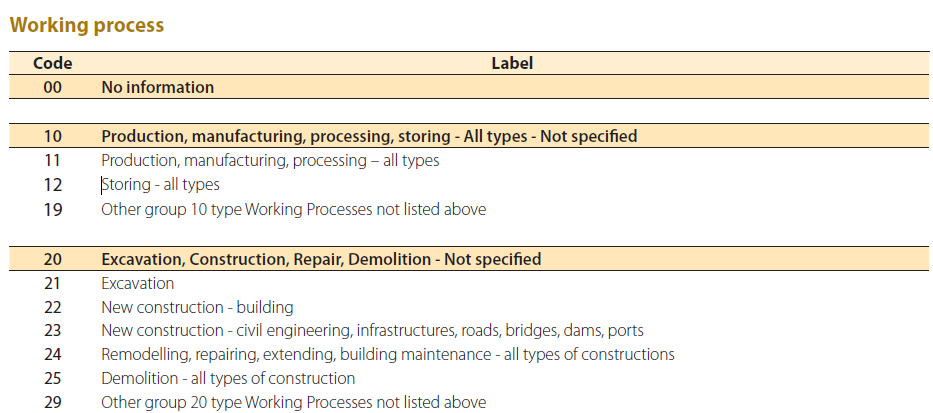
Data Quality Alert: information on specific activity is often available, but documentation could be improved
- Both the values “00” (majority) and “0” (minority, in 2015) are present in the notifications; this could be mentioned in the documentation
- As well the category ‘Geen informatie (GR)’ (7.6%) as real “NA” (3.9%) are present in the data; the difference is not clear
- the variable “specific activity” reminds of the variable “specific physical activity” of the ESAW system, but actually seems to match the ESAW “working process” variable (European Statistics on Accidents at Work (ESAW), 2013)
Summary specific activity: production and services are the categories with highest numbers (but 4% is missing)
- total number of validated notifications: 218034
- total number of validated notifications with missing information on specific activity: 8290
- percentage of validated notifications with missing information on specific activity: 3.8%
2.7.2.9 Type of workstation (ordinary, temporary or other)
Information concerning type of workstation (workpost) is recorded in the variable TYPEPOSTTRAV. KSZ states that the variable is not valid any more since 31/12/2016. This variable is however still available in the notifications under the XML tag <workPostCategory>.
Details on the workpost category of the victim are shown in Table 2.34.
| werkpostcategorie | catworkstat | n | perc | percnotna |
|---|---|---|---|---|
| 1 | Usual workstation or within the usual local unit of work | 141596 | 64.9 | 78.5 |
| 2 | Occasional or mobile workstation or in a journey on behalf of the employer | 26461 | 12.1 | 14.7 |
| 3 | Other workstation | 12294 | 5.6 | 6.8 |
| NA | Not specified | 37683 | 17.3 | NA |
Although the workpost category seems to use other labels, it seems to be equivalent to the ESAW workstation variable as shown in Figure 2.24.
Data Quality Alert: information on workstat category is often available, but documentation could be improved
- while KSZ states that the codes of the variable are not valid any more, data is still present in the notifications
- the proportions in the categories seem reasonable
- almost 20% of the notifications have missing information on the workstation category, this percentage does not seem to evolve in time (data not shown)
Summary workstat category: 4/5 happens at the ordinary workplace, <1/5 at the temporary workplace (but 17% is missing)
- total number of validated notifications: 218034
- total number of validated notifications with missing information on workstat category: 37683
- percentage of validated notifications with missing information on workstat category: 17.28%
2.7.2.10 Usual professional work activity (false or true)
This variable clarifies whether the victim was performing an activity in the context of his usual occupation at the time of the accident. The information is stored in the KSZ data warehouse under the variable PROFHABENT. The codes are not clarified, but we assume the 0/1 values present in the data correspond to a true/false statement. The variable is available in the notifications under the XML tag <usualWorkActivity>.
Details on the usual professional activity of the victim are shown in Table 2.35.
| normale_jobactiviteit | catnormact | n | perc | percnotna |
|---|---|---|---|---|
| false | false | 92351 | 42.4 | 63.6 |
| true | true | 52781 | 24.2 | 36.4 |
| NA | NA | 72902 | 33.4 | NA |
Data Quality Alert: information on usual professional work activity is often available, but documentation could be improved
- KSZ does not state that the false/true values present in the data represent a logical false or true; this could be documented
- more than 30% of the notifications have missing information on this variable and this percentage does not seem to evolve in time (data not shown)
Summary usual professional work activity: 2/3 happens during the exercition of an unusual activity (but >30% is missing)
- total number of validated notifications: 218034
- total number of validated notifications with missing information on usual professional work activity category: 72902
- percentage of validated notifications with missing information on usual professional work activity category: 33.44%
2.7.3 Organisation related factors
2.7.3.1 Place of the accident (in the company, on the road, elsewhere)
This variable indicates the place of the accident in four broad categories. The information is stored in the KSZ data warehouse under the variable CLIEUACC. The variable is available in the notifications under the XML tag <placeCategory>.
Details on the place of the accident are shown in Table 2.36.
| categorie_plaats_ongeval | catplaceacc | n | perc | percnotna |
|---|---|---|---|---|
| 1 | In de onderneming of een vestigingsplaats | 116030 | 53.2 | 53.2 |
| 2 | Op de openbare weg, verkeersongeval | 21260 | 9.8 | 9.8 |
| 3 | Op de openbare weg, geen verkeersongeval | 22991 | 10.5 | 10.5 |
| 4 | Op een andere plaats | 57729 | 26.5 | 26.5 |
| 5 | unknown | 24 | 0.0 | 0.0 |
At this point, it seems relevant to mention that ESAW uses a working environment variable as shown in Figure 2.25. This kind of information does not seem to be available in the KSZ data warehouse nor in the notifications.
Data Quality Alert: information on the place of the accident is always available, but documentation could be improved
- the variable does not contain any missings, but since 2023 however, a small proportion of notifications contains a value “5” under the variable place of the accident; KSZ does not state what the code means at this time and this could be improved in the documentation
- also in the internal Liantis documentation documentation, information for the label “5” is absent
- in personal communication with the FEDRIS stats team 22th of may 2025, it was confirmed that the category with value “5” does exist; the meaning of this label is known and should be documented as “thuiswerk” (home office).
Summary place of the accident: 1/2 happens within the enterprise and from the 1/5 that happens on the road, half is reported as traffic accident (there are no missings)
- total number of validated notifications: 218034
- total number of validated notifications with missing information on place of the accident category: 0
- total number of validated notifications with value “5” (unknown label) on place of the accident category: 24
2.7.3.2 Country of the accident
The variable which indicates in which country the accident occurred, is stored in the KSZ data warehouse under the variable CPAYSACC available in the notifications under the XML tag <countryCode>. In the dataset, the values typically consist of five characters. However, an exception occurs between October 26 and October 30, 2015, during which the two leading zeros appear to be missing.
| 2015-10-26 | 2015-10-27 | 2015-10-28 | 2015-10-29 | 2015-10-30 | |
|---|---|---|---|---|---|
| 2014 | 0 | 1 | 0 | 0 | 1 |
| 2015 | 4 | 105 | 91 | 118 | 72 |
The Statbel authentic source with landcodes provides Nationaal Instituut voor de Statistiek (NIS) (or REFNIS) codes. These are three-digit numerical identifiers used by the “Nationaal Instituut voor de Statistiek” (National Institute for Statistics). After removing leading zeros from these codes in the dataset, the resulting values can be used to identify corresponding countries. However, not all NIS codes can be directly mapped to current country names. For instance, a duplicate entry (NIS code 310) corresponding to the Republic of Dahomey, now Benin, must be excluded. Additionally, several codes present in the dataset are no longer valid according to the Statbel classification. These can, however, be reconciled using supplementary information available from the Belgian Social Security website:
- 131: Unie d. Socialist. Sovjetrep. (present in the data, added)
- 134: Duitsland (present in the data, added)
- 234: Hong-Kong (present in the data, added)
- 310: Dahomey (duplicate, removed)
- 711: Onbepaald (present in the data, added)
- 995: Op zee (present in the data, added)
- 999: Onbekend (present in the data, added)
While KSZ, does not provide documentation on the used codes for country of the accident, it does so for country of the employer in the variable CPAYSEMPL. But this list also does not contain all codes present in the data (e.g.g 131 and 134) and contains two categories with the label “onbepaald” (711 and 999).
Details on the country of the accident are shown in Table 2.38 and Table 2.39.
| NIScountry | NISlandname | NIScat | n | perc | percnotna | ncat |
|---|---|---|---|---|---|---|
| 150 | Koninkrijk België | Belgium | 215478 | 98.8 | 98.8 | 215478 |
| 103 | Bondsrepubliek Duitsland | Neighbour country | 251 | 0.1 | 0.1 | 2041 |
| 104 | Duitse Democratische Republiek | Neighbour country | 2 | 0.0 | 0.0 | 2041 |
| 111 | Franse Republiek | Neighbour country | 1096 | 0.5 | 0.5 | 2041 |
| 113 | Groothertogdom Luxemburg | Neighbour country | 147 | 0.1 | 0.1 | 2041 |
| 129 | Koninkrijk der Nederlanden | Neighbour country | 540 | 0.2 | 0.2 | 2041 |
| 134 | Duitsland | Neighbour country | 5 | 0.0 | 0.0 | 2041 |
| 101 | Republiek Albanië | Other country | 2 | 0.0 | 0.0 | 373 |
| 102 | Vorstendom Andorra | Other country | 2 | 0.0 | 0.0 | 373 |
| 105 | Republiek Oostenrijk | Other country | 18 | 0.0 | 0.0 | 373 |
| 108 | Koninkrijk Denemarken | Other country | 9 | 0.0 | 0.0 | 373 |
| 109 | Koninkrijk Spanje | Other country | 68 | 0.0 | 0.0 | 373 |
| 110 | Republiek Finland | Other country | 1 | 0.0 | 0.0 | 373 |
| 112 | Verenigd Koninkrijk van Groot-Brittannië en Noord-Ierland | Other country | 33 | 0.0 | 0.0 | 373 |
| 114 | Helleense Republiek | Other country | 5 | 0.0 | 0.0 | 373 |
| NIScat | ncat | perc | percnotna |
|---|---|---|---|
| Belgium | 215478 | 98.8 | 98.8 |
| Neighbour country | 2041 | 0.9 | 0.9 |
| Other country | 373 | 0.2 | 0.2 |
| Undetermined/Unknown | 77 | 0.0 | 0.0 |
| At sea | 30 | 0.0 | 0.0 |
| NA | 35 | 0.0 | NA |
Data Quality Alert: information on the country of the accident is almost always available, but documentation could be improved
- a small set of NIS codes (115 notifications, 0.05%) occur which are not defined in the Statbel documentation (131/134/234/995)
- the 104 code is deprecated since 1992, it is not clear why such a code can be present in the dataset
- an even smaller set of notifications (35 notifications, 0.02%) does not have a NIS code (NA)
- KSZ could make a reference to the current list of active NIS codes (e.g. Statbel) as well as provide a list with other occurring values (131/134/234/995) to unambiguously identify the country where the accident happened as well as when the information is not available (711/999/NA) after harmonizing the labels with other available country variable documentation e.g. CPAYSEMPL
Summary country of the accident: 99% happens in Belgium, 1% in a neighbour country (<0.1% is missing)
- total number of validated notifications: 218034
- total number of validated notifications with missing information on country of the accident category: 150
- percentage of validated notifications with missing information on country of the accident category: 0.07%
2.7.3.3 Postal code of the accident
The variable CPOSTACC indicates in which Belgian community (postal code) the accident took place. The information is available in the notifications under the XML tag <postalCode>. In the data, it exists almost always out of four characters. Exceptions are found for accidents not happening in Belgium or when the postal code is “NA” (Table 2.40).
| CountryBelgium | PostalCode4Char | n | perc | percnotna |
|---|---|---|---|---|
| TRUE | TRUE | 201482 | 92.4 | 92.4 |
| TRUE | FALSE | 0 | 0.0 | 0.0 |
| TRUE | NA | 13996 | 6.4 | 6.4 |
| FALSE | TRUE | 249 | 0.1 | 0.1 |
| FALSE | FALSE | 675 | 0.3 | 0.3 |
| FALSE | NA | 1597 | 0.7 | 0.7 |
| NA | TRUE | 0 | 0.0 | 0.0 |
| NA | FALSE | 0 | 0.0 | 0.0 |
| NA | NA | 35 | 0.0 | NA |
No information on current valid postal codes is provided on the KSZ site for FEDRIS variables. The Postcode variable used by the Federal Pension Service in contrary, is documented. We would expect that the same identifiers for Belgian municipalities could be used. In the current project, we used the Github repo of Mathias Leroy to map the postal codes to the Belgian communities (together with and their geographic information). The object constructed from the repo was called datam and is used further in the analysis.
All cleaned postal codes with Geographic Information System (GIS) information from the ‘datam’ object where then used for mapping with the postal code of the accident in the dataset.
To visualize the outcomes of this process, we employ the R packages sp, tmap, and BelgiumMaps.Statbel to generate thematic maps that represent the number of notifications through color-coded spatial distributions.
The result of the mapping of number of notifications to Belgian municipalities is shown in Figure 2.26. It can be clearly seen that the number of notifications is not evenly distributed across the country. For further analysis, it will be important to take into account the regional distribution of notifications e.g. by generating a representative sample of notifications from each province.
Risks for research, analytics and development
Mapping of the filtered and validated notifications reveals that occupational accidents in our dataset are not evenly distributed across the Belgian provinces. This uneven distribution may be partially attributed to the higher concentration of Liantis customers in certain provinces such as West Flanders. It will therefore be essential to account for this factor during the analysis phase, for example by examining a representative subset of the data.
| CountryBelgium | PostalCode4Char | Mapped | n | perc | percnotna |
|---|---|---|---|---|---|
| TRUE | TRUE | TRUE | 201304 | 92.3 | 92.3 |
| TRUE | TRUE | FALSE | 178 | 0.1 | 0.1 |
| TRUE | FALSE | TRUE | 0 | 0.0 | 0.0 |
| TRUE | FALSE | FALSE | 0 | 0.0 | 0.0 |
| TRUE | NA | TRUE | 0 | 0.0 | 0.0 |
| TRUE | NA | FALSE | 13996 | 6.4 | 6.4 |
| FALSE | TRUE | TRUE | 0 | 0.0 | 0.0 |
| FALSE | TRUE | FALSE | 249 | 0.1 | 0.1 |
| FALSE | FALSE | TRUE | 0 | 0.0 | 0.0 |
| FALSE | FALSE | FALSE | 675 | 0.3 | 0.3 |
| FALSE | NA | TRUE | 0 | 0.0 | 0.0 |
| FALSE | NA | FALSE | 1597 | 0.7 | 0.7 |
| NA | TRUE | TRUE | 0 | 0.0 | 0.0 |
| NA | TRUE | FALSE | 0 | 0.0 | 0.0 |
| NA | FALSE | TRUE | 0 | 0.0 | 0.0 |
| NA | FALSE | FALSE | 0 | 0.0 | 0.0 |
| NA | NA | TRUE | 0 | 0.0 | 0.0 |
| NA | NA | FALSE | 35 | 0.0 | NA |
Data Quality Alert: postal codes are often available and can be mapped, but documentation could be improved
- only a minority (16730 notifications, 7.67%) could not be mapped to a Belgian municipality
- KSZ could make reference to the current list of active NIS postal codes (e.g. BPost) to unambiguously identify the municipality where the accident happened, as well as clearly indicating when this information is not available after harmonizing the labels with available postal code variable documentation e.g. Postcode
Summary postal code of the accident: >92% can be mapped (~7.1% is missing)
- total number of validated notifications: 218034
- number of notifications from accidents happening in Belgium with a four-character postal code correctly mapped to a Belgian municipality: 201304
- number of notifications from accidents happening in Belgium with a four-character postal code not correctly mapped to a Belgian municipality: 178
- number of notifications from accidents happening outside Belgium (not mapped to a Belgian municipality): 2521
2.7.3.4 Street adress of the accident
After filtering on FEDRIS variables, we learn that KSZ only documents at country and postal code level. However, in the source data, the street adress of the accident is available under the XML tags <streetName> and <houseNumber> (the latter not being parsed in our dataset).
Details on the availability of the street address of the accident are shown in Table 2.42.
| nastreetacc | n | perc |
|---|---|---|
| FALSE | 114919 | 52.7 |
| TRUE | 103115 | 47.3 |
Data Quality Alert: street adress of the accident is often unavailable and documentation can be improved
Summary street adress of the accident: only availble in half of the notifications (47% is missing)
- total number of validated notifications: 218034
- number of notifications without street adress of the accident 103115
- percentage of notifications without street adress of the accident 47.29%
2.7.3.5 Worksite number of the accident
When screening the list of 340 variables available after filtering the KSZ data warehouse variables on the FEDRIS institution, the list does not seem to document any worksite number. However, in the data, a worksite number of the accident is available under the XML tag <workSiteNumber>.
Examples of the content of the <workSiteNumber> XML tag in the notifications are shown in Table 2.43. The field does not seem to be structured since a mix of text and numbers seems to appear. Moreover, the proportion of “NA” values is very high.
| workSiteNumber_plaats_ongeval | n | perc | percnotna |
|---|---|---|---|
| NA | 213134 | 97.8 | NA |
| 1 | 75 | 0.0 | 1.5 |
| 97151181 | 60 | 0.0 | 1.2 |
| 2 | 59 | 0.0 | 1.2 |
| campus Aalst | 46 | 0.0 | 0.9 |
| 020 | 32 | 0.0 | 0.7 |
| 30 | 0.0 | 0.6 | |
| 26 | 0.0 | 0.5 | |
| OPENBARE WEG | 18 | 0.0 | 0.4 |
| 0 | 15 | 0.0 | 0.3 |
| . | 14 | 0.0 | 0.3 |
| - | 10 | 0.0 | 0.2 |
Details on the availability of the worksite number of the accident are shown in Table 2.44.
| naworksitenumber | n | perc |
|---|---|---|
| FALSE | 4900 | 2.2 |
| TRUE | 213134 | 97.8 |
Data Quality Alert: worksite number of the accident is almost always unavailable and documentation can be improved
Summary worksite number of the accident: only availble in 2% of the notifications (98% is missing)
- total number of validated notifications: 218034
- number of notifications without worksite number 213134
- percentage of notifications without worksite number 97.75%
2.7.3.6 Size of the company
This variable indicates the size class of the number of employees in the organisation where the victim was employed at the time of the accident, at the end of the previous quarter. The information is stored in the KSZ data warehouse under the variable CTAILLEEMPL and is available in the notifications under the XML tag <numberOfEmployeesCategory>.
Details on the size of the employer by number of employees at the end of the last quarter is shown in Table 2.45.
| categorie_grootte_klant | catsizeemp | n | perc | percnotna |
|---|---|---|---|---|
| 1 | 1 - 4 | 15552 | 7.1 | 7.1 |
| 2 | 5 - 9 | 13741 | 6.3 | 6.3 |
| 3 | 10 - 19 | 18013 | 8.3 | 8.3 |
| 4 | 20 - 49 | 31680 | 14.5 | 14.5 |
| 5 | 50 - 99 | 23736 | 10.9 | 10.9 |
| 6 | 100 - 199 | 26732 | 12.3 | 12.3 |
| 7 | 200 - 499 | 33364 | 15.3 | 15.3 |
| 8 | 500 - 999 | 21108 | 9.7 | 9.7 |
| 9 | >= 1000 | 34018 | 15.6 | 15.6 |
| NA | NA | 90 | 0.0 | NA |
Although the size of the company category variable uses other labels, it partially matches the ESAW size of the enterprise variable as shown in Figure 2.27.
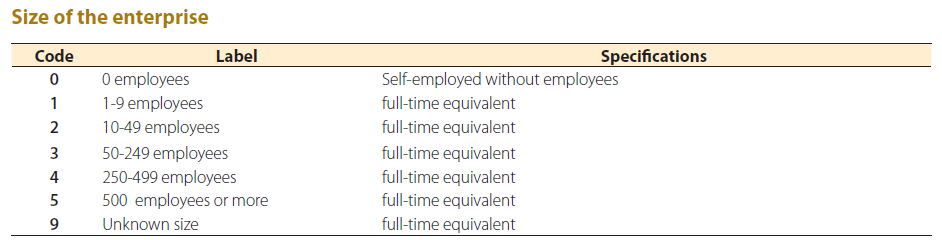
Data Quality Alert: size of the company is almost always available
- the KSZ documentation talks about the number of workers, the ESAW documentation about the number of Full Time Equivalent (VTE in Dutch) (FTE) employees
- we need to pay attention to the definition of the size of the company and be cautious when making any comparisons
Summary size of the company (<0.05% is missing)
- total number of validated notifications: 218034
- number of notifications without size of the company 90
- percentage of notifications without size of the company 0.04%
2.7.3.7 Country code of the company
KSZ, provides documentation on the used codes for country of the employer in the variable CPAYSEMPL. This list does not contain all codes used in the data (131,134) and contains two categories with the label “onbepaald” (711,999). Mapping of the codes was done as described in the previous paragraph Section 2.7.3.2.
While Table 2.39 shows that there are almost no missing values for the country code of the accident, many missing values are found for the country code of the employer. Further exploring learns that many of these missing values occur when the OA took place in the public sector (Table 2.46).
| sector | n | perc | percnotna |
|---|---|---|---|
| private | 89 | 0.6 | 0.6 |
| public | 14090 | 99.0 | 99.0 |
| NA | 53 | 0.4 | 0.4 |
Data Quality Alert: information on the country of the employer almost always available for the private sector
- a large set of notifications (14232 notifications, 6.53%) does not have a NIS code for the country of the employer
- Given that approximately 99% of these notifications originate from the public sector, we assume in the present study that most, if not all, should include the country code 150, corresponding to the label Belgium. The authors recommend that the correct country code be explicitly included in all notifications, even in seemingly obvious cases. This is particularly relevant in scenarios involving, for example, employees of Belgian embassies who may experience occupational accidents while abroad.
Summary country of the employer: 93.3% is located in Belgium, 0.2% in another country (and 6.5% is missing)
- total number of validated notifications: 218034
- total number of validated notifications with missing information on country of the employer: 14232
- percentage of validated notifications with missing information on country of the employer: 6.53%
2.7.3.8 Postal code of the company
The variable CPOSTEMPL indicates in which Belgian community (postal code) the employer is located. The information is available in the notifications under the XML tag <postalCode>. In the dataset, this variable typically consists of four characters. Exceptions are observed in cases where the accident did not occur in Belgium or when the postal code is marked as “NA” (see Table 2.47).
| CountryBelgium | PostalCode4Char | n | perc | percnotna |
|---|---|---|---|---|
| TRUE | TRUE | 203333 | 93.3 | 99.8 |
| TRUE | FALSE | 0 | 0.0 | 0.0 |
| TRUE | NA | 0 | 0.0 | 0.0 |
| FALSE | TRUE | 0 | 0.0 | 0.0 |
| FALSE | FALSE | 469 | 0.2 | 0.2 |
| FALSE | NA | 0 | 0.0 | 0.0 |
| NA | TRUE | 0 | 0.0 | 0.0 |
| NA | FALSE | 0 | 0.0 | 0.0 |
| NA | NA | 14232 | 6.5 | NA |
The same procedure as described in Section 2.7.3.3 was used to add the geographical information of the employer to the dataset with notifications. All cleaned postal codes with GIS information from the ‘datam’ object where then used for mapping with the postal code of the company in the dataset.
Data Quality Alert: postal codes of the employer are often available and can be mapped, but documentation could be improved
- a minority (14744 notifications, 6.76%) could not be mapped to a Belgian municipality
- KSZ could make reference to the current list of active NIS postal codes (e.g. BPost) to unambiguously identify the municipality of the employer, as well as clearly indicating when this information is not available after harmonizing the labels with available postal code variable documentation e.g. Postcode
- While it may be reasonable to assume that employers in the Belgian public sector are located in Belgium, it is not possible to infer their exact postal codes when this information is missing; the authors therefore recommend that the correct postal code be explicitly included in the notifications in such cases
Summary postal code of the employer: 93.2% can be mapped, 0.2% cannot be mapped (and 6.5% is missing)
- total number of validated notifications: 218034
- number of notifications from accidents happening under an employer located in Belgium with a four-character postal code correctly mapped to a Belgian municipality: 203290
- number of notifications from accidents happening under an employer located in Belgium with a four-character postal code not correctly mapped to a Belgian municipality: 43
- number of notifications from accidents happening under an employer located outside Belgium (not mapped to a Belgian municipality): 469
- number of notifications from accidents without information on the postal code: 14232
2.7.3.9 Insurance company
Quality of information concerning the insurer is already partially discussed under Section 2.5.4 and Section 2.5.5.
However, presented numbers were based on notification counts before validation and filtering. We summarize the number of notifications after validation and filtering in Table 2.48 below.
| pseudins | n | perc |
|---|---|---|
| pseudins12 | 50719 | 23.3 |
| pseudins08 | 39454 | 18.1 |
| pseudins11 | 24393 | 11.2 |
| pseudins02 | 19999 | 9.2 |
| pseudins05 | 20154 | 9.2 |
| pseudins03 | 17487 | 8.0 |
| pseudins07 | 14142 | 6.5 |
| pseudins01 | 10955 | 5.0 |
| pseudins09 | 8286 | 3.8 |
| pseudins10 | 8080 | 3.7 |
| pseudins04 | 4307 | 2.0 |
| pseudins06 | 30 | 0.0 |
| pseudins13 | 28 | 0.0 |
Summary insurer: 3 insurers cover half of all notifications (no missings)
- total number of validated notifications: 218034
- total number of validated notifications with missing information on the insurer: 0
2.7.5 Temporal factors
2.7.5.1 Date of the occupational accident
The variable DATONG in the KSZ data warehouse indicates on which date the accident occurred. This information is available in the notifications under the XML tag <date>.
The number of notifications per year (derived from the date of the OA in the notification message) is shown in Table 2.50. The effect of the COVID-19 pandemic is clearly visible in the data, with a drop in notifications in 2020.
| yearOA | n | perc |
|---|---|---|
| 2014 | 20423 | 9.4 |
| 2015 | 20298 | 9.3 |
| 2016 | 21285 | 9.8 |
| 2017 | 21467 | 9.8 |
| 2018 | 24166 | 11.1 |
| 2019 | 24496 | 11.2 |
| 2020 | 20204 | 9.3 |
| 2021 | 21811 | 10.0 |
| 2022 | 21819 | 10.0 |
| 2023 | 22065 | 10.1 |
Summary date of the occupational accident: except during the COVID-19 pandemic, no big fluctuations (no missings)
- total number of validated notifications: 218034
- total number of validated notifications with missing information on the date (year) of the occupational accident: 0
2.7.5.2 Hour of the occupational accident
The variable HEUREACC in the KSZ data warehouse indicates at which hour the accident occurred. This information is available in the notifications under the XML tag <hour>.
The number of notifications per hour of the date of the OA is shown in Table 2.51 and Figure 2.28.
| hourOA | n | perc | percnotna |
|---|---|---|---|
| 00:00:00 | 2064 | 0.9 | 1.0 |
| 01:00:00 | 1155 | 0.5 | 0.5 |
| 02:00:00 | 979 | 0.4 | 0.5 |
| 03:00:00 | 1067 | 0.5 | 0.5 |
| 04:00:00 | 1584 | 0.7 | 0.7 |
| 05:00:00 | 2807 | 1.3 | 1.3 |
| 06:00:00 | 6314 | 2.9 | 3.0 |
| 07:00:00 | 13927 | 6.4 | 6.6 |
| 08:00:00 | 18612 | 8.5 | 8.8 |
| 09:00:00 | 17783 | 8.2 | 8.4 |
| 10:00:00 | 22680 | 10.4 | 10.7 |
| 11:00:00 | 21227 | 9.7 | 10.0 |
| 12:00:00 | 11622 | 5.3 | 5.5 |
| 13:00:00 | 14397 | 6.6 | 6.8 |
| 14:00:00 | 17393 | 8.0 | 8.2 |
| 15:00:00 | 17025 | 7.8 | 8.1 |
| 16:00:00 | 12994 | 6.0 | 6.2 |
| 17:00:00 | 8325 | 3.8 | 3.9 |
| 18:00:00 | 5533 | 2.5 | 2.6 |
| 19:00:00 | 3761 | 1.7 | 1.8 |
| 20:00:00 | 3486 | 1.6 | 1.6 |
| 21:00:00 | 2876 | 1.3 | 1.4 |
| 22:00:00 | 2072 | 1.0 | 1.0 |
| 23:00:00 | 1597 | 0.7 | 0.8 |
| NA | 6754 | 3.1 | NA |
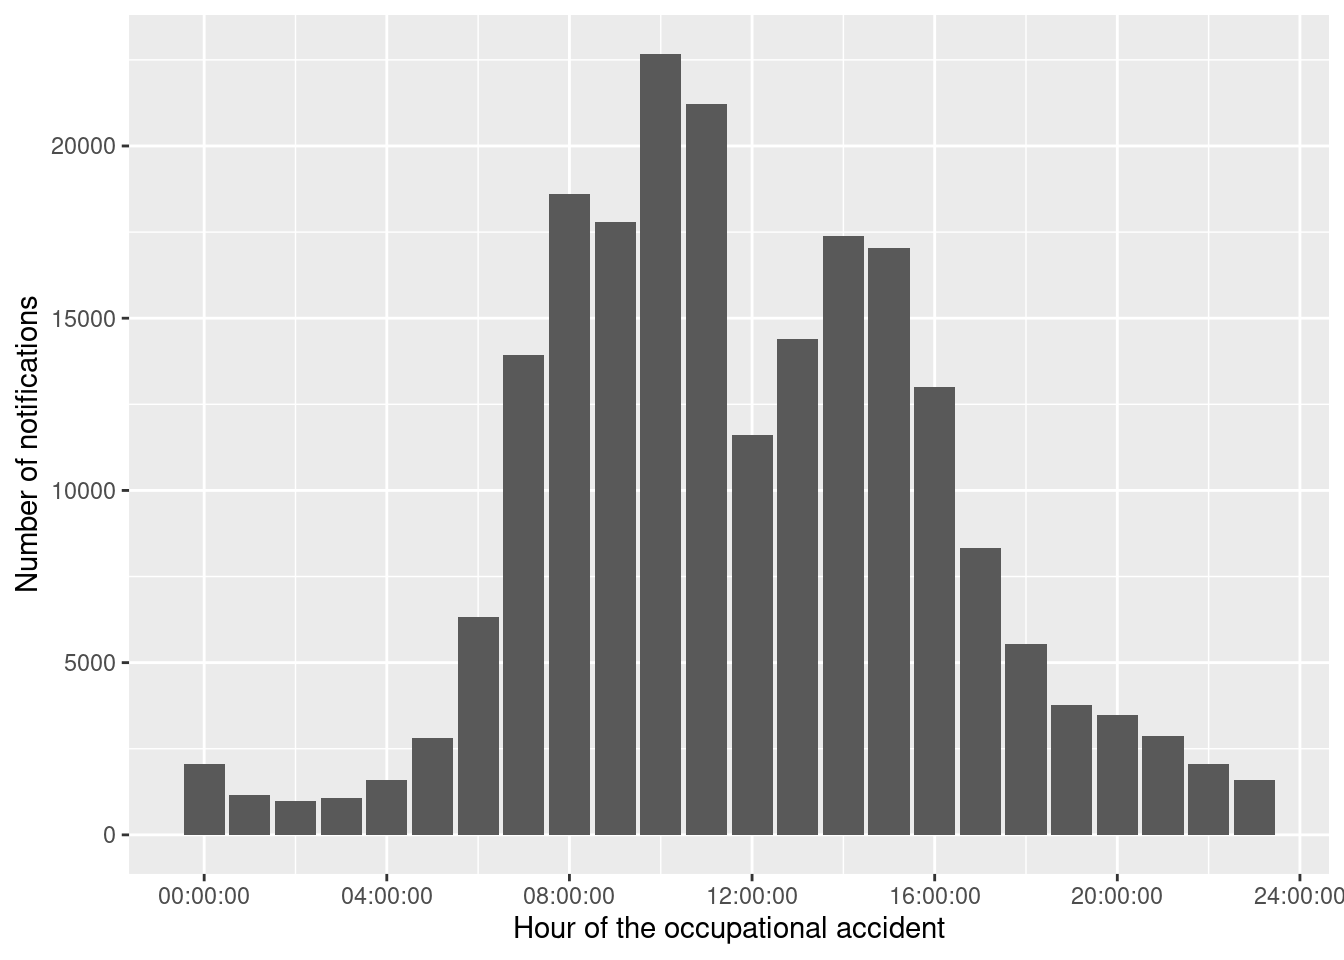
Although the hour of the OA variable within KSZ uses other labels, it matches the ESAW time of the accident variable quite good as shown in Figure 2.29 (NA corresponding to 99 time of accident unknown) (European Statistics on Accidents at Work (ESAW), 2013).
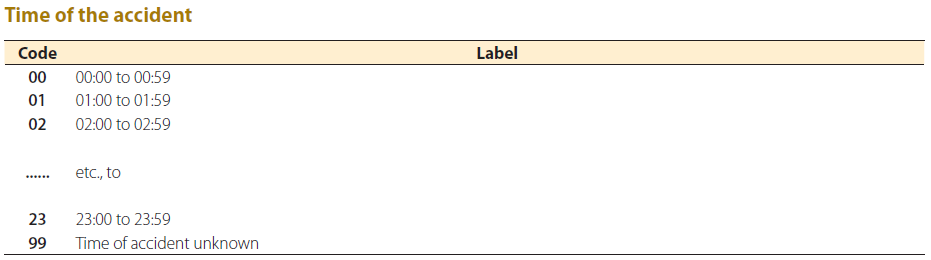
Data Quality Alert: documentation could be improved
- resolution at hour level corresponds to what ESAW uses in its classification system
- if data is available at higher resolution (e.g. minute level), this could be transmitted through the notifications to increase variation and to have more insight into the time of the occupational accident relative to the start and end of the working hours or lunch break (see Section 2.7.5.3)
Summary hour of the occupational accident: a bimodal distribution (peaks around 10/11h and 14/15h) (with 3.2% missings)
- total number of validated notifications: 218034
- total number of validated notifications with missing information on the hour of the accident: 6754
- percentage of validated notifications with missing information on the hour of the accident: 3.1%
2.7.5.3 Time of the occupational accident relative to the working hours
In Section 2.7.2.7 we already discussed four relevant variables:
- HRNORDEBACC: start of workday
- HRNORFINACC: end of workday
- HRPAUSDEB: start of lunch break
- HRPAUSFIN: end of lunch break
When combined with the variable: hourOA, we can calculate the time of the OA relative to the start, lunch break and end of the working day.
The number of notifications by hour of the accident is shown in Figure 2.30.
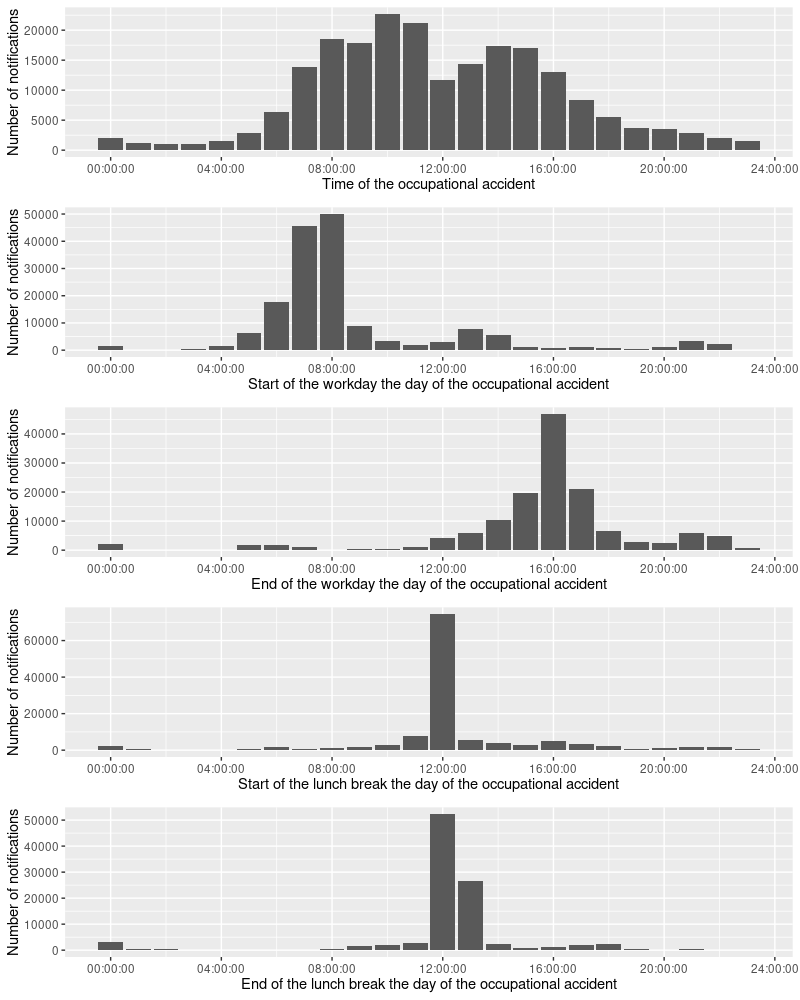
The number of notifications by hour of the accident relative to the start and end of the workday is shown in Table 2.52
| cattimeOA | n | perc | percnotna |
|---|---|---|---|
| before working hours | 16358 | 7.5 | 11.4 |
| at start of working hours | 16010 | 7.3 | 11.1 |
| during working hours | 96276 | 44.2 | 66.9 |
| at end of working hours | 11714 | 5.4 | 8.1 |
| after working hours | 3445 | 1.6 | 2.4 |
| NA | 74231 | 34.0 | NA |
Data Quality Alert: in 2/3 cases the working hours can be used as a relative reference (not the lunch break)
- resolution at hour level is not precise enough to make a distinction between an occupational accident happening before, at or after the start and end of the working hours
- concerning the lunch break information we report >80% missing values; within the 20% notifications containing data, a peak for end or lunch is also noticed at 00:00:00
Summary time of the occupational accident relative to the working hours: 2/3 during working hours, 10% at the end or after working hours (>35% is missing for length of working hours, >50% for length of lunch breaks)
- total number of validated notifications: 218034
- total number of validated notifications with missing information on the hour of the accident: 6754
- total number of validated notifications with missing information on the start of the working hours: 53519
- total number of validated notifications with missing information on the end of the working hours: 76545
- total number of validated notifications with missing information length of the working hours: 76717
- percentage of notifications with missing information on the length of the working hours: 35.2%
- total number of validated notifications with missing information on the start of the lunch break: 95196
- total number of validated notifications with missing information on the end of the lunch break: 117467
- total number of validated notifications with missing information length of the lunch break: 117981
- percentage of notifications with missing information on the length of the lunch break: 54.1%
2.8 Data quality assessment of the validated FEDRIS notifications (meta and outcome variables)
2.8.1 Accident meta variables (simplified declarations, creation dates and numbers)
2.8.1.1 Simplified declarations
Whether a simplified declaration is made, is stored in the KSZ data warehouse under the variable CDRSSIMPL and available in the notifications under the XML tag <simplifiedDeclaration>. The variable indicates whether the OA been the subject of an electronic declaration via the social security portal. This electronic declaration method only concerns OA that have resulted in an incapacity of less than 4 days.
Details on the simplified declaration variable are shown in Table 2.53.
| vereenvoudigde_aangifte | catsimplified | n | perc |
|---|---|---|---|
| false | false | 200178 | 91.8 |
| true | true | 17856 | 8.2 |
Data Quality Alert: the simplified declaration variable seems to be of good quality
- all FEDRIS notifications have a value for the simplified declaration category
- the percentage (<10%) however seems rather low; we would expect more people being eligible to use the simplified declaration route if we take the information from Table 1.2 into account (even if the final validated number of absence days is not available at the time of declaration)
Summary on the simplified declaration category: 8.2% notifications describe accidents being reported through a simplified declaration procedure (0% is missing)
- total number of validated notifications: 218034
- total number of validated notifications with missing information on simplified declaration category: 0
- total number of validated notifications with a positive value for simplified declaration category: 17856 (8.19%)
Potential for further investigation
The simplified declaration pathway (<10% cases) may currently be underutilized (<50% cases less than 4 days absence). Stakeholders are encouraged to further explore how the administrative burden can be reduced and how awareness and appropriate use of the simplified declaration can be increased.
2.8.1.2 Creation dates and numbers of the Insurer and the FEDRIS dossiers
See also Section 2.5.5 higher up in the text. Whenever an OA is declared to the insurer, it gets assigned an insurer dossier number NRACC and an insurer dossier creation date DRECEPASS. The first variable (NRACC) indicates the dossier number of the OAs insurer of the employer although the documentation indicates that the variable was only valid until 2004 and the second one the date on which the insurer received the declaration of the OA. In the next step, a FEDRIS OAF number NRACCF and OA file creation date DCREAT are assigned when FEDRIS receives the data from the insurer. All four in the KSZ data warehouse stored variables are passed through in the notifications under the respective XML tags <caseNumber>, <declarationDate>, <oafAccidentFileNumber> and <accidentFileCreationDate>. Additionally, the notification also contains information under the XML tag <policyNumber> although no documentation on the (assumed) insurance policy could be found in the KSZ data warehouse.
The number of notifications by time difference in days is shown in Figure 2.31.
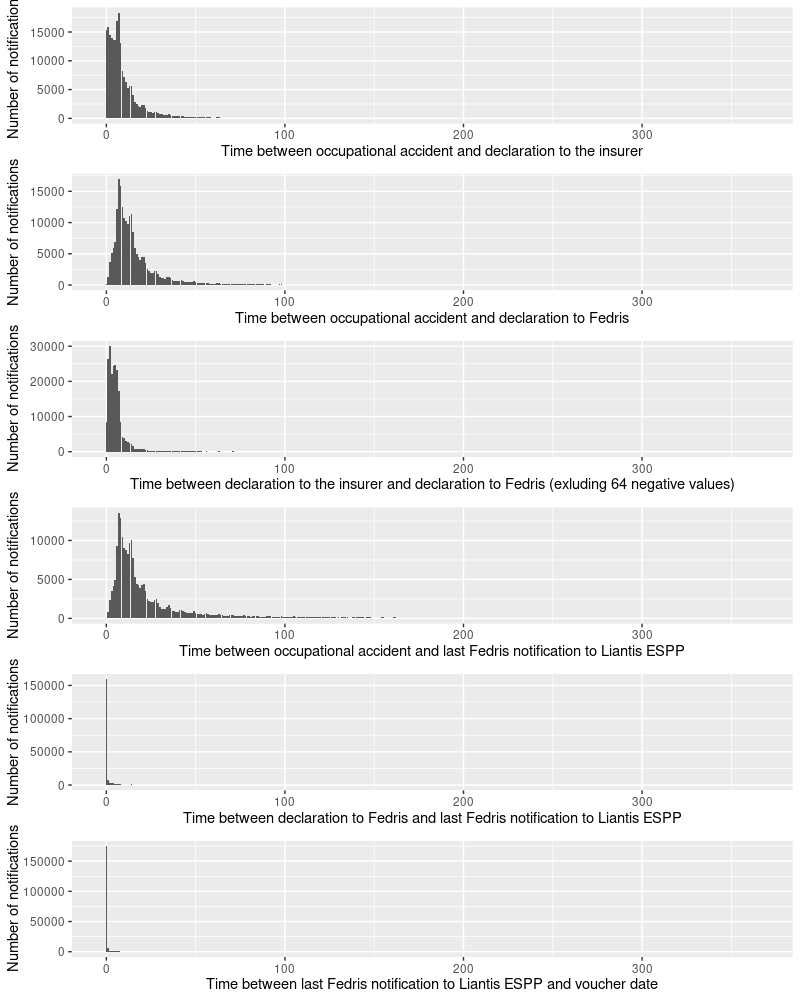
Further details on the timedifferences are shown in Table 2.54.
| deltas | 0% | 1% | 5% | 10% | 20% | 25% | 50% | 75% | 80% | 90% | 95% | 99% | 100% |
|---|---|---|---|---|---|---|---|---|---|---|---|---|---|
| datedeclOAinsfile-dateOA | 0 days | 0 days | 0 days | 1 days | 2 days | 3 days | 7 days | 13 days | 15 days | 25 days | 41 days | 112 days | 362 days |
| datedeclOAfedrisfile-dateOA | 0 days | 2 days | 4 days | 5 days | 7 days | 8 days | 12 days | 20 days | 23 days | 36 days | 56 days | 150 days | 365 days |
| datedeclOAfedrisfile-datedeclOAinsfile | -138 days | 0 days | 1 days | 1 days | 2 days | 2 days | 4 days | 7 days | 7 days | 12 days | 18 days | 69 days | 365 days |
| datenotiOAfedrisfile-dateOA | 0 days | 2 days | 4 days | 6 days | 8 days | 9 days | 15 days | 31 days | 40 days | 84 days | 149 days | 279 days | 365 days |
| datenotiOAfedrisfile-datedeclOAfedrisfile | 0 days | 0 days | 0 days | 0 days | 0 days | 0 days | 0 days | 1 days | 4 days | 41 days | 105 days | 249 days | 361 days |
| dateVoucher-datenotiOAfedrisfile | 0 days | 0 days | 0 days | 0 days | 0 days | 0 days | 0 days | 0 days | 0 days | 91 days | 209 days | 304 days | 361 days |
Data Quality Alert: all time stamps seem to be of good quality, but documentation could be improved
- all FEDRIS notifications have timestamps for the declaration to the insurer, first declaration to Fedris, last notification of FEDRIS and timestamp of the voucher sent to Liantis ESPP
- the NRACC variable is present in the KSZ data warehouse and in the notification data, but the KSZ documentation indicates that the variable is invalid since 2004
- it might happen that new insurer declarations for a same accident are made after the first declaration to FEDRIS, resulting in negative time differences in the retained final records
Summary on the meta information of the dates: a final FEDRIS declaration can occur before a final insurer declaration and no updates are sent longer than 365 days after the occurrence of an occupational accident (0% is missing)
- total number of validated notifications: 218034
- total number of validated notifications with missing information on dates: 0
2.8.2 Accident category (commuting)
2.8.2.1 Accidents on the way to work
Whether an OA happens during commuting or at the workplace is stored in the KSZ data warehouse under the variable CWEG and is available in the notifications under the XML tag <onWayToWork>.
Details on the recoded catcommuting variable are shown in Table 2.55.
| WOON_WERK_FEDRIS | catcommuting | n | perc |
|---|---|---|---|
| false | false | 185446 | 85.1 |
| true | true | 32588 | 14.9 |
Data Quality Alert: the commuting variable seems to be of good quality
All FEDRIS notifications have a value for the commuting category.
Summary on the commuting category: 15% notifications describe accidents happing on the way to work (0% is missing)
- total number of validated notifications: 218034
- total number of validated notifications with missing information on commuting: 0
- total number of validated notifications with a positive value for commuting: 32588 (14.95%)
2.8.3 Accident properties (deviations, injuries, agents,…)
2.8.3.1 Injured body part
This variable identifies the part of the body affected by an injury. It is stored in the KSZ data warehouse under the variable LOCLES06 and appears in notifications under the XML tag <injuredBodyPart>. It corresponds to the two-digit code for “Part of the body injured” as defined in the European Statistics on Accidents at Work (ESAW) - Summary methodology - 2013 edition (European Statistics on Accidents at Work (ESAW), 2013).
In practice, the variable typically consists of two characters. However, as shown in Table 2.56, there were some anomalies in 2015 where a leading zero appears to be missing. This issue is further illustrated in Figure 2.32, which highlights the potential discrepancy when compared to the ESAW coding system. The hierarchical structure of the codes is clearly visible in Figure 2.32 (b), where the main categories are highlighted in yellow.
| 1 | 2 | |
|---|---|---|
| 2014 | 0 | 20423 |
| 2015 | 8 | 20290 |
| 2016 | 0 | 21285 |
| 2017 | 0 | 21467 |
| 2018 | 0 | 24166 |
| 2019 | 0 | 24496 |
| 2020 | 0 | 20204 |
| 2021 | 0 | 21811 |
| 2022 | 0 | 21819 |
| 2023 | 0 | 22065 |
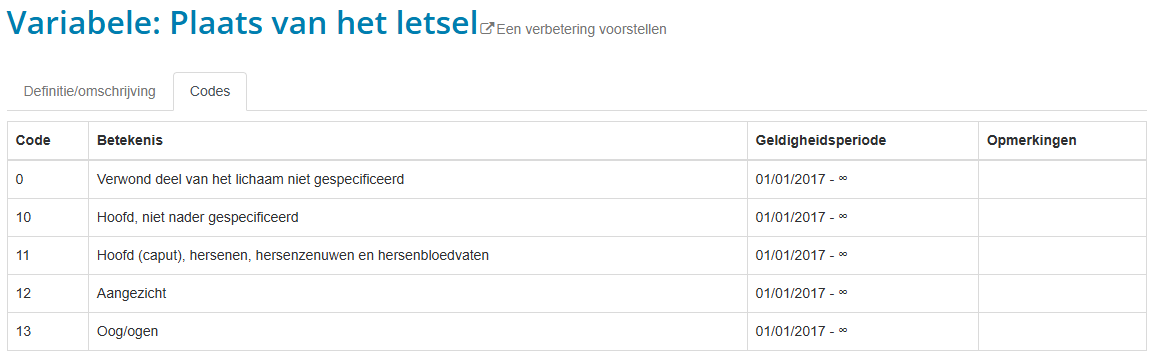
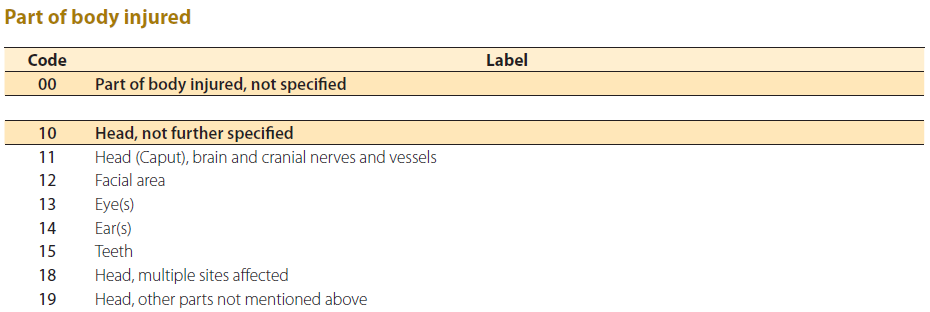
Details on the injured body part category variable (using the ESAW labels) are shown in Table 2.57.
| catinjbodypart | LOCLESESAW2013CODELABEL | n | perc |
|---|---|---|---|
| 00 | Part of body injured, not specified | 4280 | 2.0 |
| 10 | Head, not further specified | 5218 | 2.4 |
| 11 | Head (Caput), brain and cranial nerves and vessels | 2450 | 1.1 |
| 12 | Facial area | 5097 | 2.3 |
| 13 | Eye(s) | 10150 | 4.7 |
| 14 | Ear(s) | 615 | 0.3 |
| 15 | Teeth | 1361 | 0.6 |
| 18 | Head, multiple sites affected | 988 | 0.5 |
| 19 | Head, other parts not mentioned above | 979 | 0.4 |
| 20 | Neck, inclusive spine and vertebra in the neck | 3179 | 1.5 |
| 21 | Neck, inclusive spine and vertebra in the neck | 1660 | 0.8 |
| 29 | Neck, other parts not mentioned above | 926 | 0.4 |
| 30 | Back, including spine and vertebra in the back | 8318 | 3.8 |
| 31 | Back, including spine and vertebra in the back | 5965 | 2.7 |
| 39 | Back, other parts not mentioned above | 2919 | 1.3 |
| 40 | Torso and organs, not further specified | 387 | 0.2 |
| 41 | Rib cage, ribs including joints and shoulder blades | 5814 | 2.7 |
| 42 | Chest area including organs | 480 | 0.2 |
| 43 | Pelvic and abdominal area including organs | 908 | 0.4 |
| 48 | Torso, multiple sites affected | 486 | 0.2 |
| 49 | Torso, other parts not mentioned above | 330 | 0.2 |
| 50 | Upper Extremities, not further specified | 1209 | 0.6 |
| 51 | Shoulder and shoulder joints | 9317 | 4.3 |
| 52 | Arm, including elbow | 11011 | 5.1 |
| 53 | Hand | 15899 | 7.3 |
| 54 | Finger(s) | 35465 | 16.3 |
| 55 | Wrist | 8053 | 3.7 |
| 58 | Upper extremities, multiple sites affected | 1277 | 0.6 |
| 59 | Upper extremities, other parts not mentioned above | 285 | 0.1 |
| 60 | Lower Extremities, not further specified | 1502 | 0.7 |
| 61 | Hip and hip joint | 1672 | 0.8 |
| 62 | Leg, including knee | 22062 | 10.1 |
| 63 | Ankle | 13000 | 6.0 |
| 64 | Foot | 12168 | 5.6 |
| 65 | Toe(s) | 2016 | 0.9 |
| 68 | Lower extremities, multiple sites affected | 919 | 0.4 |
| 69 | Lower Extremities, other parts not mentioned above | 937 | 0.4 |
| 70 | Whole body and multiple sites, not further specified | 1055 | 0.5 |
| 71 | Whole body (Systemic effects) | 467 | 0.2 |
| 78 | Multiple sites of the body affected | 11934 | 5.5 |
| 99 | Other Parts of body injured, not mentioned above | 5276 | 2.4 |
Details on the injured body part group variable (using the ESAW labels) are shown in Table 2.58.
| LOCLESESAW2013GROUPLABEL | n | perc |
|---|---|---|
| Upper Extremities | 82516 | 37.8 |
| Lower Extremities | 54276 | 24.9 |
| Head | 26858 | 12.3 |
| Back | 17202 | 7.9 |
| Whole body and multiple sites | 13456 | 6.2 |
| Torso and organs | 8405 | 3.9 |
| Neck | 5765 | 2.6 |
| Other Parts of body injured, not mentioned above | 5276 | 2.4 |
| Part of body injured, not specified | 4280 | 2.0 |
Data Quality Alert: the injured body part category seems to be of good quality (but the documentation could be improved)
- all FEDRIS notifications include a value for the injured body part category
- although the KSZ documentation defines a 1-digit code “0”, in practice the 2-digit code “00” -which aligns with the ESAW codification- is consistently used (European Statistics on Accidents at Work (ESAW), 2013), except for eight cases in 2015, which we corrected in our dataset
- this discrepancy suggests that the documentation could be updated for consistency
- the ESAW coding system is hierarchical in nature; however, this structure is not clearly reflected in the KSZ documentation due to the absence of visual or structural mark-up, this could be updated to enhance clarity
Summary on injured body part: 2/3 of injuries occur at upper and lower extremities (0% is missing)
- total number of validated notifications: 218034
- total number of validated notifications with missing or divergent codes on injured body part category: 8
- total number of validated notifications with clear codes on injured body part category: 218026
- percentage of validated notifications with missing or divergent codes on injured body part category: 0%
2.8.3.2 Nature (type) of the injury
This variable captures the physical consequences of the injury (e.g., fracture, dislocation, cut) and is stored in the KSZ data warehouse under the variable NATLES06. It is available in the notifications under the XML tag <natureOfInjury>. The variable corresponds to “Type of injury” 3-digit code variable described in the European Statistics on Accidents at Work (ESAW) - Summary methodology - 2013 edition (European Statistics on Accidents at Work (ESAW), 2013).
In practice, the variable almost always consists of three characters. However, as shown in Table 2.59, a few exceptions were observed in 2014 and 2015, where one or two leading zeros appear to be missing. This issue is illustrated in Figure 2.33, which highlights the potential inconsistency when compared to the ESAW coding system. The hierarchical structure of the codes is clearly visible in Figure 2.33 (b), where the main categories are highlighted in yellow.
| 1 | 2 | 3 | |
|---|---|---|---|
| 2014 | 0 | 2 | 20421 |
| 2015 | 19 | 350 | 19929 |
| 2016 | 0 | 0 | 21285 |
| 2017 | 0 | 0 | 21467 |
| 2018 | 0 | 0 | 24166 |
| 2019 | 0 | 0 | 24496 |
| 2020 | 0 | 0 | 20204 |
| 2021 | 0 | 0 | 21811 |
| 2022 | 0 | 0 | 21819 |
| 2023 | 0 | 0 | 22065 |
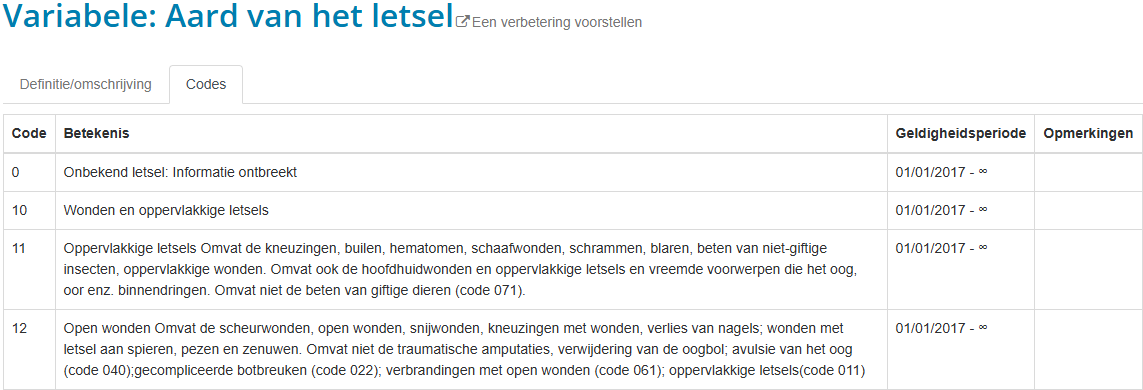
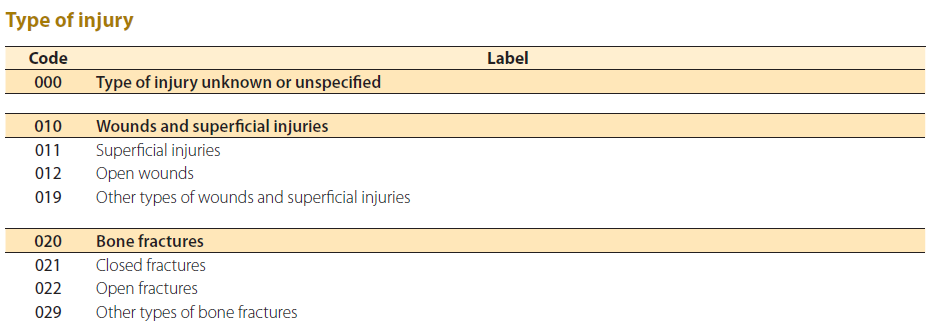
Details on the nature (type) of the injury category variable (using the ESAW labels) are shown in Table 2.60.
| catinjtype | NATLESESAW2013CODELABEL | n | perc |
|---|---|---|---|
| 000 | Type of injury unknown or unspecified | 9813 | 4.5 |
| 010 | Wounds and superficial injuries | 19539 | 9.0 |
| 011 | Superficial injuries | 59675 | 27.4 |
| 012 | Open wounds | 21827 | 10.0 |
| 013 | NA | 791 | 0.4 |
| 019 | Other types of wounds and superficial injuries | 2428 | 1.1 |
| 020 | Bone fractures | 7123 | 3.3 |
| 021 | Closed fractures | 7605 | 3.5 |
| 022 | Open fractures | 622 | 0.3 |
| 029 | Other types of bone fractures | 766 | 0.4 |
| 030 | Dislocations, sprains and strains | 23133 | 10.6 |
| 031 | Dislocations and subluxations | 2832 | 1.3 |
| 032 | Sprains and strains | 26135 | 12.0 |
| 039 | Other types of dislocations, sprains and strains | 6933 | 3.2 |
| 040 | Traumatic amputations (Loss of body parts) | 297 | 0.1 |
| 041 | NA | 140 | 0.1 |
| 050 | Concussion and internal injuries | 5491 | 2.5 |
| 051 | Concussion and intracranial injuries | 1517 | 0.7 |
| 052 | Internal injuries | 3387 | 1.6 |
| 053 | NA | 80 | 0.0 |
| 054 | NA | 111 | 0.1 |
| 059 | Other types of concussion and internal injuries | 682 | 0.3 |
| 060 | Burns, scalds and frostbites | 709 | 0.3 |
| 061 | Burns and scalds (thermal) | 1785 | 0.8 |
| 062 | Chemical burns (corrosions) | 765 | 0.4 |
| 063 | Frostbites | 15 | 0.0 |
| 069 | Other types of burns, scalds and frostbites | 196 | 0.1 |
| 070 | Poisonings and infections | 526 | 0.2 |
| 071 | Acute poisonings | 174 | 0.1 |
| 072 | Acute infections | 420 | 0.2 |
| 073 | NA | 3 | 0.0 |
| 079 | Other types of poisonings and infections | 633 | 0.3 |
| 080 | Drowning and asphyxiation | 2 | 0.0 |
| 081 | Asphyxiation | 50 | 0.0 |
| 089 | Other types of drowning and asphyxiation | 6 | 0.0 |
| 090 | Effects of sound, vibration and pressure | 124 | 0.1 |
| 091 | Acute hearing losses | 44 | 0.0 |
| 092 | Effects of pressure (barotrauma) | 54 | 0.0 |
| 099 | Other effects of sound, vibration and pressure | 155 | 0.1 |
| 100 | Effects of temperature extremes, light and radiation | 45 | 0.0 |
| 101 | Heat and sunstroke | 43 | 0.0 |
| 102 | Effects of radiation (non-thermal) | 29 | 0.0 |
| 103 | Effects of reduced temperature | 2 | 0.0 |
| 109 | Other effects of temperature extremes, light and radiation | 27 | 0.0 |
| 110 | Shock | 585 | 0.3 |
| 111 | Shocks after aggression and threats | 486 | 0.2 |
| 112 | Traumatic shocks | 345 | 0.2 |
| 119 | Other types of shocks | 210 | 0.1 |
| 120 | Multiple injuries | 2553 | 1.2 |
| 999 | Other specified injuries not included under other headings | 7121 | 3.3 |
Details on the nature (type) of the injury group variable (using the ESAW labels) are shown in Table 2.61.
| NATLESESAW2013GROUPLABEL | n | perc |
|---|---|---|
| Wounds and superficial injuries | 103469 | 47.5 |
| Dislocations, sprains and strains | 59033 | 27.1 |
| Bone fractures | 16116 | 7.4 |
| Concussion and internal injuries | 11077 | 5.1 |
| Type of injury unknown or unspecified | 9813 | 4.5 |
| Other specified injuries not included under other headings | 7121 | 3.3 |
| Burns, scalds and frostbites | 3470 | 1.6 |
| Multiple injuries | 2553 | 1.2 |
| Poisonings and infections | 1753 | 0.8 |
| Shock | 1626 | 0.7 |
| NA | 1125 | 0.5 |
| Effects of sound, vibration and pressure | 377 | 0.2 |
| Effects of temperature extremes, light and radiation | 146 | 0.1 |
| Traumatic amputations (Loss of body parts) | 297 | 0.1 |
| Drowning and asphyxiation | 58 | 0.0 |
Data Quality Alert: the type of injury category seems to be of good quality (but the documentation could be improved)
- the KSZ documentation defines 1- to 3-digit codes where the ESAW codification only uses a 3-digit code (European Statistics on Accidents at Work (ESAW), 2013)
- our dataset shows 3 digit codes in most of the cases, except for 371 cases in 2014 and 2015, where leading zero’s appeared to be missing; we corrected these values in our dataset before proceeding
- this discrepancy suggests that the documentation could be updated for consistency
- the ESAW coding system is hierarchical in nature; however, this structure is not clearly reflected in the KSZ documentation due to the absence of visual or structural mark-up, this could be updated to enhance clarity
Summary on nature of the injury: wounds and dislocations account for 3/4 of notifications (0% is missing)
- total number of validated notifications: 218034
- total number of validated notifications with missing or divergent codes (1- or 2- instead of 3-digit codes) on type of injury category: 371
- total number of validated notifications with clear (3-digit) codes on type of injury category: 217663
- percentage of validated notifications with missing or divergent codes on type of injury category: 0.17%
2.8.3.3 Deviation
This variable indicates the last event, deviating from the normal, that led to the accident. It is the description of what has abnormally occurred, the “deviation” from the normal process of executing the work. The deviation is the event that caused the accident. If multiple events follow each other, the last deviating event is registered (which is closest in time to the injurious contact). It is stored in the KSZ data warehouse under the variable DEVIATION and available in the notifications under the XML tag <deviation>. The variable corresponds to the “Deviation” 2-digit code variable described in the European Statistics on Accidents at Work (ESAW) - Summary methodology - 2013 edition (European Statistics on Accidents at Work (ESAW), 2013).
In practice, the variable almost always consists of three characters. However, as shown in Table 2.62, a few exceptions were observed in 2015, where one leading zero appears to be missing. This issue is illustrated in Figure 2.34, which highlights the potential inconsistency when compared to the ESAW coding system. The hierarchical structure of the codes is clearly visible in Figure 2.34 (b), where the main categories are highlighted in yellow.
| 1 | 2 | |
|---|---|---|
| 2014 | 0 | 20423 |
| 2015 | 15 | 20283 |
| 2016 | 0 | 21285 |
| 2017 | 0 | 21467 |
| 2018 | 0 | 24166 |
| 2019 | 0 | 24496 |
| 2020 | 0 | 20204 |
| 2021 | 0 | 21811 |
| 2022 | 0 | 21819 |
| 2023 | 0 | 22065 |
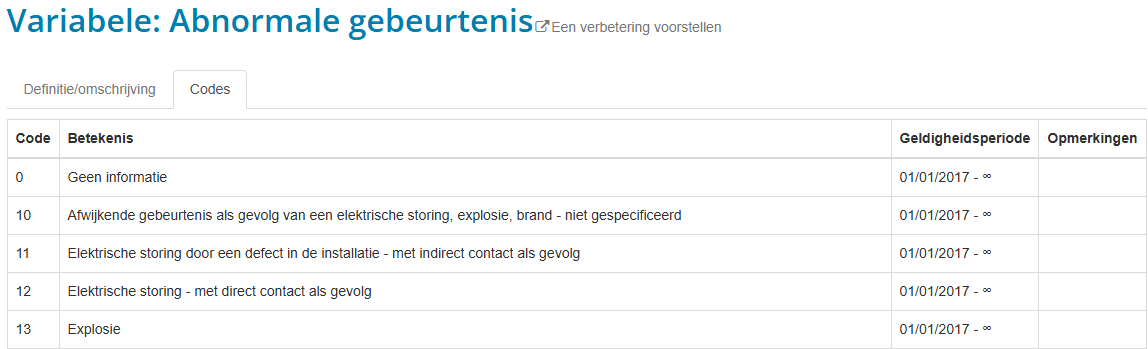
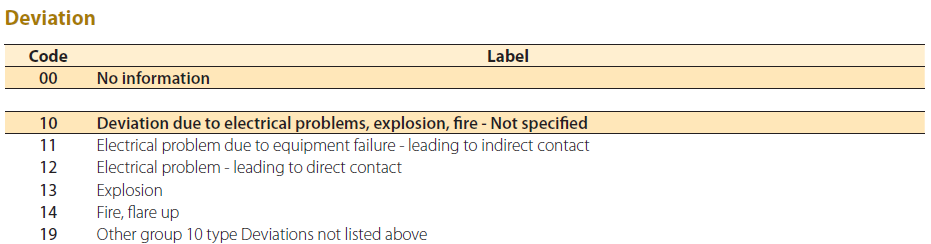
Details on the deviation category variable (using the ESAW labels) are shown in Table 2.63.
| catdeviation | DEVIATIONESAW2013CODELABEL | n | perc |
|---|---|---|---|
| 00 | No information | 12040 | 5.5 |
| 10 | Deviation due to electrical problems, explosion, fire - Not specified | 137 | 0.1 |
| 11 | Electrical problem due to equipment failure - leading to indirect contact | 160 | 0.1 |
| 12 | Electrical problem - leading to direct contact | 227 | 0.1 |
| 13 | Explosion | 161 | 0.1 |
| 14 | Fire, flare up | 216 | 0.1 |
| 19 | Other group 10 type Deviations not listed above | 440 | 0.2 |
| 20 | Deviation by overflow, overturn, leak, flow, vaporisation, emission - Not specified | 741 | 0.3 |
| 21 | Solid state - overflowing, overturning | 775 | 0.4 |
| 22 | Liquid state - leaking, oozing, flowing, splashing, spraying | 2768 | 1.3 |
| 23 | Gaseous state - vaporisation, aerosol formation, gas formation | 459 | 0.2 |
| 24 | Pulverulent material - smoke generation, dust/particles in suspension/emission of | 2910 | 1.3 |
| 29 | Other group 20 type Deviations not listed above | 436 | 0.2 |
| 30 | Breakage, bursting, splitting, slipping, fall, collapse of Material Agent - Not specified | 3199 | 1.5 |
| 31 | Breakage of material - at joint, at seams | 806 | 0.4 |
| 32 | Breakage, bursting - causing splinters (wood, glass, metal, stone, plastic, others) | 2484 | 1.1 |
| 33 | Slip, fall, collapse of Material Agent - from above (falling on the victim) | 6533 | 3.0 |
| 34 | Slip, fall, collapse of Material Agent - from below (dragging the victim down) | 1258 | 0.6 |
| 35 | Slip, fall, collapse of Material Agent - on the same level | 4811 | 2.2 |
| 39 | Other group 30 type Deviations not listed above | 1422 | 0.7 |
| 40 | Loss of control (total or partial) of machine, means of transport or handling equipment, hand-held tool, object, animal - Not specified | 5682 | 2.6 |
| 41 | Loss of control (total or partial) - of machine (including unwanted start-up) or of the material being worked by the machine | 2772 | 1.3 |
| 42 | Loss of control (total or partial) - of means of transport or handling equipment, (motorised or not) | 17974 | 8.2 |
| 43 | Loss of control (total or partial) - of hand-held tool (motorised or not) or of the material being worked by the tool | 11145 | 5.1 |
| 44 | Loss of control (total or partial) - of object (being carried, moved, handled, etc.) | 13221 | 6.1 |
| 45 | Loss of control (total or partial) - of animal | 241 | 0.1 |
| 49 | Other group 40 type Deviations not listed above | 1443 | 0.7 |
| 50 | Slipping - Stumbling and falling - Fall of persons - Not specified | 8653 | 4.0 |
| 51 | Fall of person - to a lower level | 6152 | 2.8 |
| 52 | Slipping - Stumbling and falling - Fall of person - on the same level | 20981 | 9.6 |
| 59 | Other group 50 type Deviations not listed above | 1199 | 0.5 |
| 60 | Body movement without any physical stress (generally leading to an external injury) - Not specified | 3520 | 1.6 |
| 61 | Walking on a sharp object | 773 | 0.4 |
| 62 | Kneeling on, sitting on, leaning against | 547 | 0.3 |
| 63 | Being caught or carried away, by something or by momentum | 6630 | 3.0 |
| 64 | Uncoordinated movements, spurious or untimely actions | 23744 | 10.9 |
| 69 | Other group 60 type Deviations not listed above | 2238 | 1.0 |
| 70 | Body movement under or with physical stress (generally leading to an internal injury) - Not specified | 3987 | 1.8 |
| 71 | Lifting, carrying, standing up | 9580 | 4.4 |
| 72 | Pushing, pulling | 4266 | 2.0 |
| 73 | Putting down, bending down | 950 | 0.4 |
| 74 | Twisting, turning | 1839 | 0.8 |
| 75 | Treading badly, twisting leg or ankle, slipping without falling | 4936 | 2.3 |
| 79 | Other group 70 type Deviations not listed above | 2132 | 1.0 |
| 80 | Shock, fright, violence, aggression, threat, presence - Not specified | 2206 | 1.0 |
| 81 | Shock, fright | 1373 | 0.6 |
| 82 | Violence, aggression, threat - between company employees subjected to the employer’s authority | 416 | 0.2 |
| 83 | Violence, aggression, threat - from people external to the company towards victims performing their duties (bank holdup, bus drivers, etc.) | 4270 | 2.0 |
| 84 | Aggression, jostle - by animal | 1068 | 0.5 |
| 85 | Presence of the victim or of a third person in itself creating a danger for oneself and possibly others | 435 | 0.2 |
| 89 | Other group 80 type Deviations not listed above | 905 | 0.4 |
| 99 | Other Deviations not listed above in this classification | 10773 | 4.9 |
Details on the deviation group variable (using the ESAW labels) are shown in Table 2.64.
| DEVIATIONESAW2013GROUPLABEL | n | perc |
|---|---|---|
| Loss of control (total or partial) of machine, means of transport or handling equipment, hand-held tool, object, animal | 52478 | 24.1 |
| Body movement without any physical stress (generally leading to an external injury) | 37452 | 17.2 |
| Slipping - Stumbling and falling - Fall of persons | 36985 | 17.0 |
| Body movement under or with physical stress (generally leading to an internal injury) | 27690 | 12.7 |
| Breakage, bursting, splitting, slipping, fall, collapse of Material Agent | 20513 | 9.4 |
| No information | 12040 | 5.5 |
| Other Deviations not listed above in this classification | 10773 | 4.9 |
| Shock, fright, violence, aggression, threat, presence | 10673 | 4.9 |
| Deviation by overflow, overturn, leak, flow, vaporisation, emission | 8089 | 3.7 |
| Deviation due to electrical problems, explosion, fire | 1341 | 0.6 |
Data Quality Alert: the deviation category seems to be of good quality (but the documentation could be improved)
- the KSZ documentation defines 1- to 2-digit codes where the ESAW codification only uses a 2-digit code (European Statistics on Accidents at Work (ESAW), 2013)
- our dataset shows 2 digit codes in most of the cases, except for 15 cases in 2015, where a leading zero appears to be missing; we corrected these values in our dataset before proceeding
- this discrepancy suggests that the documentation could be updated for consistency
- the ESAW coding system is hierarchical in nature; however, this structure is not clearly reflected in the KSZ documentation due to the absence of visual or structural mark-up, this could be updated to enhance clarity
Summary on deviation: loss of control, body movements (with/without physical stress) and slipping account for 70% of notifications (0% is missing)
- total number of validated notifications: 218034
- total number of validated notifications with missing or divergent codes (1- instead of 2-digit codes) on deviation category: 15
- total number of validated notifications with clear (2-digit) codes on type of deviation: 218019
- percentage of validated notifications with missing or divergent codes on type of deviation: 0.01%
2.8.3.4 Material agent
This variable describes the main material agent associated with the deviation. It describes the tool, object, or instrument associated with the deviation from the process, associated with what has abnormally occurred. If there are multiple material agents for the (last) deviation, the material agent that intervenes last is registered. It is stored in the KSZ data warehouse under the variable CAGMAT and available in the notifications under the XML tag <materialAgent>. In the notifications data the variable exclusively exists out of five characters, as Table 2.65 shows. Figure 2.35 illustrates the concordance with the ESAW system.
| 5 | |
|---|---|
| 2014 | 20423 |
| 2015 | 20298 |
| 2016 | 21285 |
| 2017 | 21467 |
| 2018 | 24166 |
| 2019 | 24496 |
| 2020 | 20204 |
| 2021 | 21811 |
| 2022 | 21819 |
| 2023 | 22065 |

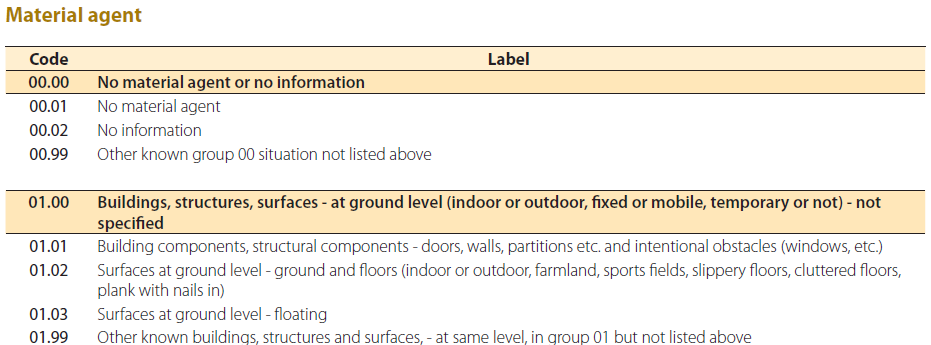
Details on the material agent group variable are shown in Table 2.66.
| CAGMATESAW2013GROUPLABEL | n | perc |
|---|---|---|
| Land vehicles | 31887 | 14.6 |
| Materials, objects, products, machine or vehicle components, debris, dust | 28941 | 13.3 |
| Buildings, structures, surfaces - at ground level (indoor or outdoor, fixed or mobile, temporary or not) | 23630 | 10.8 |
| No material agent or no information | 22662 | 10.4 |
| Hand tools, not powered | 18476 | 8.5 |
| Living organisms and human-beings | 14840 | 6.8 |
| Conveying, transport and storage systems | 14055 | 6.4 |
| Buildings, structures, surfaces - above ground level (indoor or outdoor) | 12077 | 5.5 |
| Other material agents not listed in this classification | 10588 | 4.9 |
| Office equipment, personal equipment, sports equipment, weapons, domestic appliances | 9480 | 4.3 |
| Hand-held or hand-guided tools, mechanical | 6862 | 3.1 |
| Machines and equipment – fixed | 6101 | 2.8 |
| Hand tools, without specification of power source | 3279 | 1.5 |
| Machines and equipment – portable or mobile | 3025 | 1.4 |
| Chemical, explosive, radioactive, biological substances | 2753 | 1.3 |
| Systems for the supply and distribution of materials, pipe networks | 2303 | 1.1 |
| Physical phenomena and natural elements | 2191 | 1.0 |
| Other transport vehicles | 1550 | 0.7 |
| Buildings, structures, surfaces - below ground level (indoor or outdoor) | 1027 | 0.5 |
| Bulk waste | 1050 | 0.5 |
| Safety devices and equipment | 717 | 0.3 |
| Motors, systems for energy transmission and storage | 540 | 0.2 |
Data Quality Alert: the material agent variable seems to be of good quality
Summary on material agent: land vehicles, materials, machines and buildings account for 50% of the notifications (0% is missing)
- total number of validated notifications: 218034
- total number of validated notifications with missing information on the material agent category: 0
- percentage of validated notifications with missing or divergent codes for the material agent category: 0%
2.8.3.5 Injury contact category
This variable describes the contact category or modality of the injury. It describes the way in which the victim was injured (physically or psychologically) by the “material agent” that caused the injury. If there are multiple contacts, the contact that caused the most severe injury is registered. It is stored in the KSZ data warehouse under the variable CONTOCCBL and available in the notifications under the XML tag <injuryContactCategory>. In the notifications, the variable indeed exists almost exclusively of two characters. As Table 2.67 shows, only in 2015, some exceptions are found where one leading zero seems to be missing. Figure 2.36 illustrates the absence of any documentation in the KSZ data warehouse in comparison with the ESAW system.
| 1 | 2 | |
|---|---|---|
| 2014 | 0 | 19516 |
| 2015 | 20 | 19354 |
| 2016 | 0 | 20341 |
| 2017 | 0 | 20588 |
| 2018 | 0 | 23218 |
| 2019 | 0 | 23608 |
| 2020 | 0 | 19341 |
| 2021 | 0 | 21030 |
| 2022 | 0 | 21217 |
| 2023 | 0 | 21371 |

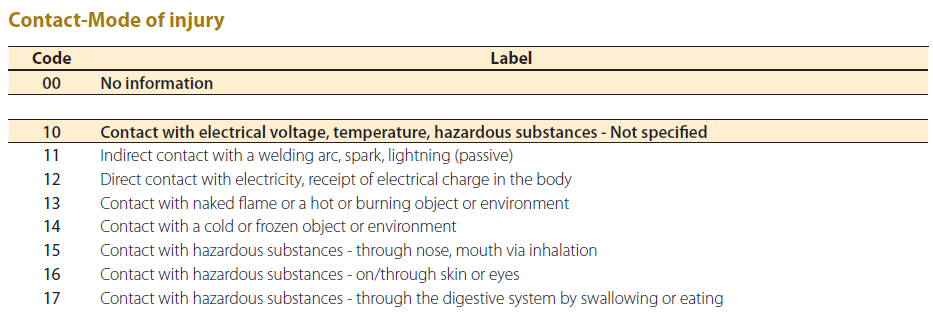
Details on the contact mode of injury group variable are shown in Table 2.68.
| CONTOCCBLESAW2013GROUPLABEL | n | perc | percnotna |
|---|---|---|---|
| Contact with sharp, pointed, rough, coarse Material Agent | 39870 | 18.3 | 19.0 |
| Horizontal or vertical impact with or against a stationary object (the victim is in motion) | 39660 | 18.2 | 18.9 |
| Struck by object in motion, collision with | 36445 | 16.7 | 17.4 |
| Physical or mental stress | 34413 | 15.8 | 16.4 |
| No information | 18638 | 8.5 | 8.9 |
| Other Contacts - Modes of Injury not listed in this classification | 11293 | 5.2 | 5.4 |
| Trapped, crushed, etc. | 10964 | 5.0 | 5.2 |
| Contact with electrical voltage, temperature, hazardous substances | 10303 | 4.7 | 4.9 |
| Bite, kick, etc. (animal or human) | 7380 | 3.4 | 3.5 |
| Drowned, buried, enveloped | 618 | 0.3 | 0.3 |
| NA | 8450 | 3.9 | NA |
Data Quality Alert: documentation could be improved
Summary on injury contact category: contacts with (sharp) material agents and impacts (victim or object in motion) account for 55% of notifications (~4% is missing)
- total number of validated notifications: 218034
- total number of validated notifications with missing information on contact mode of injury category: 8450
- percentage of validated notifications with missing information on contact mode of injury category: 3.88%
2.8.4 Accident consequences (before validation)
2.8.4.1 Incapacity category of the victim
The KSZ system captures the victim’s incapacity category using two variables: CONSEQACC (see Figure 2.37 (a)) and Consequence_accident (see Figure 2.37 (b)). Both are documented as valid from 2017 onward; however, the latter includes two additional categories. The variable is represented in the notification dataset under the XML tag <incapacityCategory>. Analysis of the dataset indicates that the newly introduced categories, labelled 7 and 8, have been in use since 2019.
| 1 | 2 | 3 | 4 | 5 | 6 | 7 | 8 | |
|---|---|---|---|---|---|---|---|---|
| 2014 | 5962 | 138 | 14190 | 100 | 12 | 21 | 0 | 0 |
| 2015 | 5962 | 131 | 14035 | 128 | 15 | 27 | 0 | 0 |
| 2016 | 6041 | 139 | 14896 | 121 | 17 | 71 | 0 | 0 |
| 2017 | 5737 | 127 | 15345 | 193 | 12 | 53 | 0 | 0 |
| 2018 | 6694 | 180 | 17000 | 199 | 25 | 68 | 0 | 0 |
| 2019 | 6379 | 189 | 17591 | 169 | 19 | 70 | 0 | 79 |
| 2020 | 5396 | 184 | 8139 | 168 | 14 | 51 | 53 | 6199 |
| 2021 | 5325 | 167 | 3246 | 196 | 16 | 50 | 215 | 12596 |
| 2022 | 5213 | 197 | 1400 | 122 | 26 | 58 | 295 | 14508 |
| 2023 | 5368 | 206 | 1412 | 116 | 16 | 36 | 389 | 14522 |
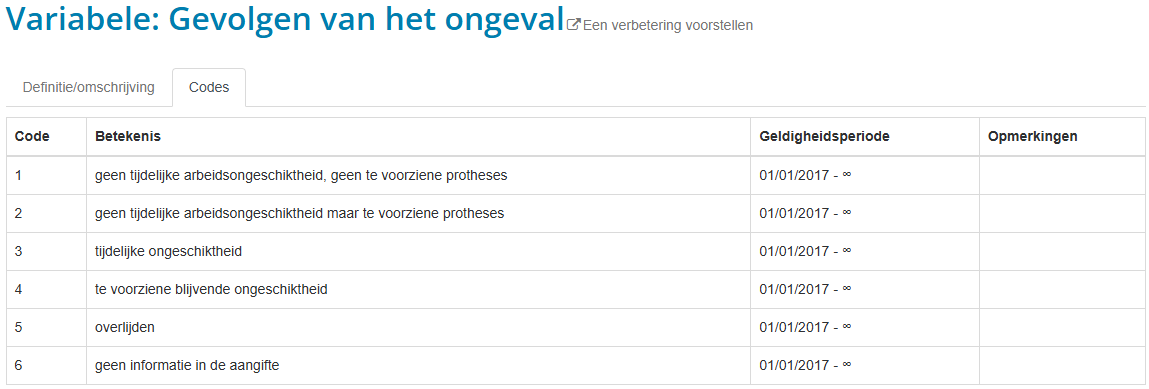
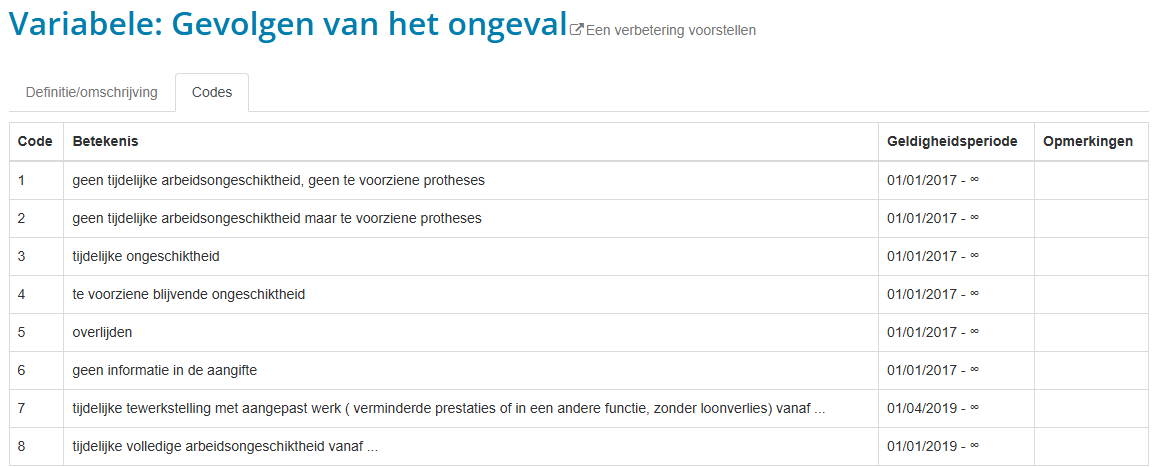
Details on the incapacity category variable are shown in Table 2.70.
| catconseqacc | 2014 | 2015 | 2016 | 2017 | 2018 | 2019 | 2020 | 2021 | 2022 | 2023 |
|---|---|---|---|---|---|---|---|---|---|---|
| tijdelijke ongeschiktheid | 14190 | 14035 | 14896 | 15345 | 17000 | 17591 | 8139 | 3246 | 1400 | 1412 |
| geen tijdelijke arbeidsongeschiktheid, geen te voorziene protheses | 5962 | 5962 | 6041 | 5737 | 6694 | 6379 | 5396 | 5325 | 5213 | 5368 |
| geen tijdelijke arbeidsongeschiktheid maar te voorziene protheses | 138 | 131 | 139 | 127 | 180 | 189 | 184 | 167 | 197 | 206 |
| te voorziene blijvende ongeschiktheid | 100 | 128 | 121 | 193 | 199 | 169 | 168 | 196 | 122 | 116 |
| geen informatie in de aangifte | 21 | 27 | 71 | 53 | 68 | 70 | 51 | 50 | 58 | 36 |
| overlijden | 12 | 15 | 17 | 12 | 25 | 19 | 14 | 16 | 26 | 16 |
| tijdelijke volledige arbeidsongeschiktheid vanaf … | 0 | 0 | 0 | 0 | 0 | 79 | 6199 | 12596 | 14508 | 14522 |
| tijdelijke tewerkstelling met aangepast werk (verminderde prestaties of in een andere functie, zonder loonverlies) vanaf … | 0 | 0 | 0 | 0 | 0 | 0 | 53 | 215 | 295 | 389 |
Data Quality Alert: new categories on the incapacity category variable: process and documentation could be improved
- KSZ has multiple pages online for the same incapacity category with different labelset definitions; this could be improved
- the new values 7 and 8 might be could be inferred from a change in rubrics 42 (“gevolgen”) of an old (see Figure 2.38) and new (see Figure 2.39) model for an occupational accident declaration form (new models via the FEDRIS webpage)
- the new values 7 and 8 appear to be more detailed forms of value 3 (temporary incapacity); in an overarching grouping variable, categories 7, 8 and 3 could be recombined for analysis purposes
Potential risks for stakeholders
Based on the information provided in Figure 2.37 and Table 2.70, it can be inferred that changes in the labelling of the victim’s incapacity category occurred in 2019/2020. However, it remains unclear to the authors how the different stakeholders of the notification process are currently informed about such changes. When a notification variable is business-critical for one or more stakeholders, it is essential to have a well-defined process in place to communicate any modifications to its labelling. The authors recommend that FEDRIS and/or KSZ ensure that, if such a process exists, it is clearly communicated to all relevant stakeholders. If no such process is currently in place, one should be developed and formally communicated.
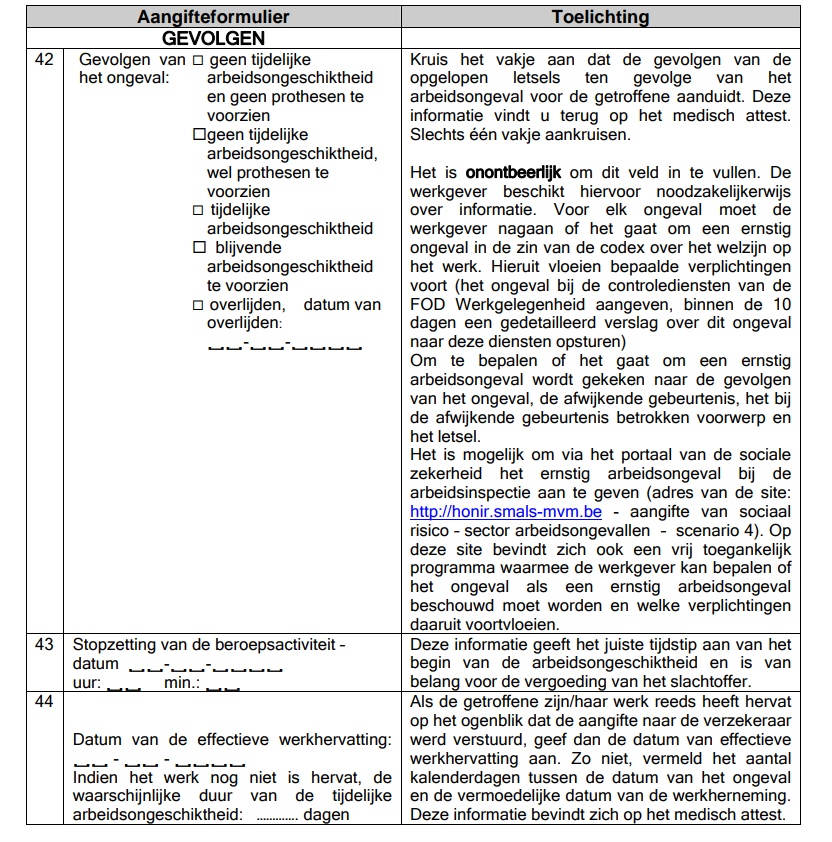
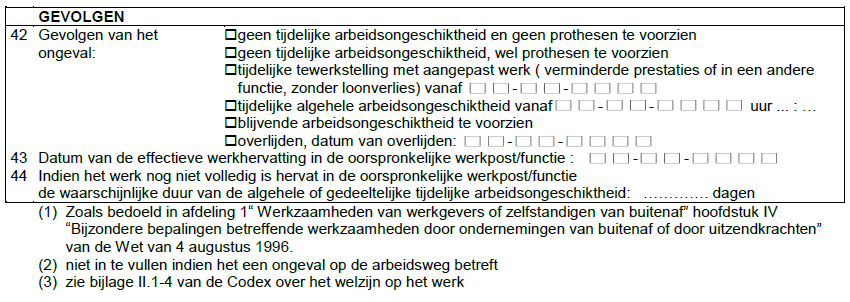
Summary on the incapacity category: more than 2/3 notifications represent accidents with temporary incapacity (0% is missing)
- total number of validated notifications: 218034
- total number of validated notifications with missing information on incapacity category: 0
- percentage of validated notifications with incapacity category value 7 or 8: 22.4%
- percentage of validated notifications with incapacity category value 3, 7 or 8: 71.6%
2.8.4.2 Seriousness of the accident
As can be learned from Figure 2.40 recovered from the occupationalAccidentNotificationLot technical documentation, this variable describes the seriousness of the accident in terms as falling under regulations in Belgian law as a “normal”, “serious” or “very serious” accident. The label can be “undetermined” too. However, the CGRAV variable is not found in the documentation of the KSZ data warehouse, although it can be found in the notifications under the XML tag <accidentSeriousness>. The data however shows that this variable always contains the value “UNDETERMINED” (Table 2.71).
| UNDETERMINED | |
|---|---|
| 2014 | 20423 |
| 2015 | 20298 |
| 2016 | 21285 |
| 2017 | 21467 |
| 2018 | 24166 |
| 2019 | 24496 |
| 2020 | 20204 |
| 2021 | 21811 |
| 2022 | 21819 |
| 2023 | 22065 |
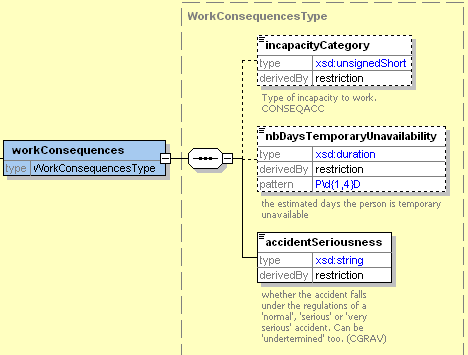
Data Quality Alert: the data only shows the value ‘UNDETERMINED’
- analysis of the data shows that the seriousness variable consistently holds the value ‘UNDETERMINED’ across all notifications throughout the entire study period
- this lack of variation was clarified in personal communication with FEDRIS: the seriousness classification is not always reliable, and therefore, this field is not used
- given the absence of variation, the variable offers no analytical value; its inclusion in the notification records may be reconsidered; options include removing the field entirely or assigning a final seriousness classification at the level of the definitive record; this would help prevent multiple stakeholders from implementing similar logic independently, potentially leading to inconsistent outcomes
- since seriousness is a key outcome in the present study, we will derive this variable independently using relevant fields available within the notification records
Summary on seriousness category: 100% ‘UNDETERMINED’
- total number of validated notifications: 218034
- total number of validated notifications with missing information on seriousness category: 0
- total number of validated notifications with an “UNDETERMINED” value for seriousness category: 218034 (100%)
2.8.4.3 Estimated number of days lost
As illustrated in Figure 2.40 and based on the occupationalAccidentNotificationLot technical documentation, this variable represents the estimated number of days a victim of an OA is expected to lose. The value is formatted as a text string following the pattern “P\d{1,4}D” that is, beginning with the letter “P”, followed by one to four digits, and ending with “D”.
Although the corresponding KSZ variable is not explicitly identified in Figure 2.40, the variable NBRJITPREV appears to be a likely candidate. This variable refers to the number of calendar days lost from the onset of incapacity until the presumed return-to-work date, thus reflecting the estimated duration of the victim’s incapacity. However, further labeling or definitional details are not provided in the documentation.
Under the XML tag <nbDaysTemporaryUnavailability>, this information is available in the notification dataset. Example values are presented in Table 2.72.
| estndaysvalue | n | perc |
|---|---|---|
| P0000D | 10609 | 4.87 |
| P0001D | 2451 | 1.12 |
| P0002D | 1771 | 0.81 |
| P0003D | 1823 | 0.84 |
| P0004D | 1744 | 0.80 |
| P0005D | 1967 | 0.90 |
| P0006D | 1012 | 0.46 |
| P0007D | 1598 | 0.73 |
| estndaysvalue | n | perc |
|---|---|---|
| P97D | 11 | 0.01 |
| P98D | 16 | 0.01 |
| P990D | 1 | 0.00 |
| P9990D | 2 | 0.00 |
| P9999D | 22900 | 10.50 |
| P999D | 94 | 0.04 |
| P99D | 51 | 0.02 |
| P9D | 3374 | 1.55 |
We extracted the estimated number of days lost from the encoded string format and conducted further analysis to investigate whether certain high-frequency values were disproportionately associated with cases where the victim was expected to die as a result of the OA. As this pattern was indeed observed, we excluded these specific values in a recoded version of the variable to avoid bias in subsequent analyses.
A summary of the estimated number of days lost is shown in Table 2.73 below. The table shows a selection of quantiles: percentages of notifications having this (or a lower) number of estimated days lost.
| quantile | estndays |
|---|---|
| 99.9% | 200 |
| 99% | 80 |
| 95.0% | 30 |
| 90.0% | 19 |
| 75.0% | 9 |
| 50.0% | 3 |
| 25.0% | 0 |
| 10.0% | 0 |
| 5.0% | 0 |
| 1.0% | 0 |
| 0.1% | 0 |
Data Quality Alert: the estimated number of days contains high frequencies for certain (strange) values
- data shows that after parsing the number of estimated days lost from the string variable, peaks in the frequencies occur (e.g. 999 and 9999 values, data not shown); if these values have a specific meaning, this could be indicated in the documentation (like ESAW does for a comparable 3-char variable Figure 2.41)
- at this point we made the assumption to consider 990, 999, 9990 and 9999 as special numbers and setting those to “NA” in a recoded variable
- FEDRIS and/or KSZ could provide clarity on the existence of special numbers and indicate this in the documentation, as it could not be derived from FEDRIS, KSZ or ESAW documentation what these values could mean
Summary on estimated number of days lost: 50% notifications have values of 3 days (estimated) or less (but 11% is missing after correction)
- total number of validated notifications: 218034
- total number of validated notifications with missing estimated number of days: 0
- total number of validated notifications with missing estimated number of days (without 990, 999, 9990 and 9999 values): 23025
- percentage of validated notifications with missing estimated number of days (without 990, 999, 9990 and 9999 values): 10.56%
2.8.5 Accident consequences (after validation)
2.8.5.1 Acceptance as an occupational accident category
As discussed in Chapter Section 2.6, the validated dossier status -indicating acceptance by the insurer- was provided by FEDRIS specifically for use in the current project. However, the relationship between this variable and existing KSZ variables, such as CSIT, which denotes the eligibility status of a dossier as an OA (see Figure 2.42), remains unclear at this stage.
The validated status of the dossier is stored in the variable STATUS in the FedrisVAL dataset. Table 2.74 below summarizes the number of notifications by validated status.
| STATUS | n | perc | percnotna |
|---|---|---|---|
| Aanvaard | 196010 | 89.9 | 90.4 |
| Geweigerd | 20902 | 9.6 | 9.6 |
| NA | 1122 | 0.5 | NA |
Data Quality Alert: the validated status variable appears to be of good quality
Data shows that after validation, the variable STATUS contains only a limited number (1122) of “NA” values.
Summary on validated status: 90% notifications get accepted, 10% refused (~0.5% is missing)
- total number of validated notifications: 218034
- total number (percentage) of validated notifications with status accepted: 196010 (89.9%)
- total number (percentage) of validated notifications with status refused: 20902 (9.59%)
- total number (percentage) of validated notifications with status missing: 1122 (0.51%)
2.8.5.2 Validated number of days lost
As outlined in Chapter Section 2.6, the validated number of days lost due to temporary incapacity was provided by FEDRIS specifically for use in this project. However, it remains unclear whether this variable encompasses the KSZ variables DUREEITT , which captures the number of paid days for full temporary incapacity, and DUREEITP, which refers to the number of paid days for partial temporary incapacity related to a specific accident. These variables are not included in the standard notification dataset and were only made available upon specific request. Illustrative data are presented in Table 2.75.
| valndaysvalue | n | perc |
|---|---|---|
| 0 | 81241 | 37.45 |
| 1 | 9626 | 4.44 |
| 2 | 8801 | 4.06 |
| 3 | 8465 | 3.90 |
| 4 | 8452 | 3.90 |
| 5 | 6487 | 2.99 |
| 6 | 5290 | 2.44 |
| 7 | 5379 | 2.48 |
| valndaysvalue | n | perc |
|---|---|---|
| 2273 | 1 | 0 |
| 2312 | 1 | 0 |
| 2328 | 1 | 0 |
| 2472 | 1 | 0 |
| 2904 | 1 | 0 |
| 3119 | 1 | 0 |
| 3876 | 1 | 0 |
| 1539104 | 1 | 0 |
A summary of the validated number of days lost is shown in Table 2.76 below. The table shows a selection of quantiles: percentages of notifications having this (or a lower) number of validated days lost. Comparison with Table 2.73 shows that the validated number of days lost is generally higher than the estimated number of days lost. The validated number of days lost is also more skewed towards higher values, with a 90th percentile of 59 days compared to 19 days in the estimated number of days lost (Table 2.73).
| quantile | valndays |
|---|---|
| 99.9% | 991 |
| 99% | 356 |
| 95.0% | 113 |
| 90.0% | 59 |
| 75.0% | 16 |
| 50.0% | 4 |
| 25.0% | 0 |
| 10.0% | 0 |
| 5.0% | 0 |
| 1.0% | 0 |
| 0.1% | 0 |
If the end date of a period is not known, it was either not provided by the insurer, or the period was not accepted as TAO. Periods without end date can not be incorporated in the total number of validated days complete TAO. More details on this would require further investigation from FEDRIS. The distribution of the validated number of days lost due to temporary incapacity is shown in Figure 2.43 (log10 axis).
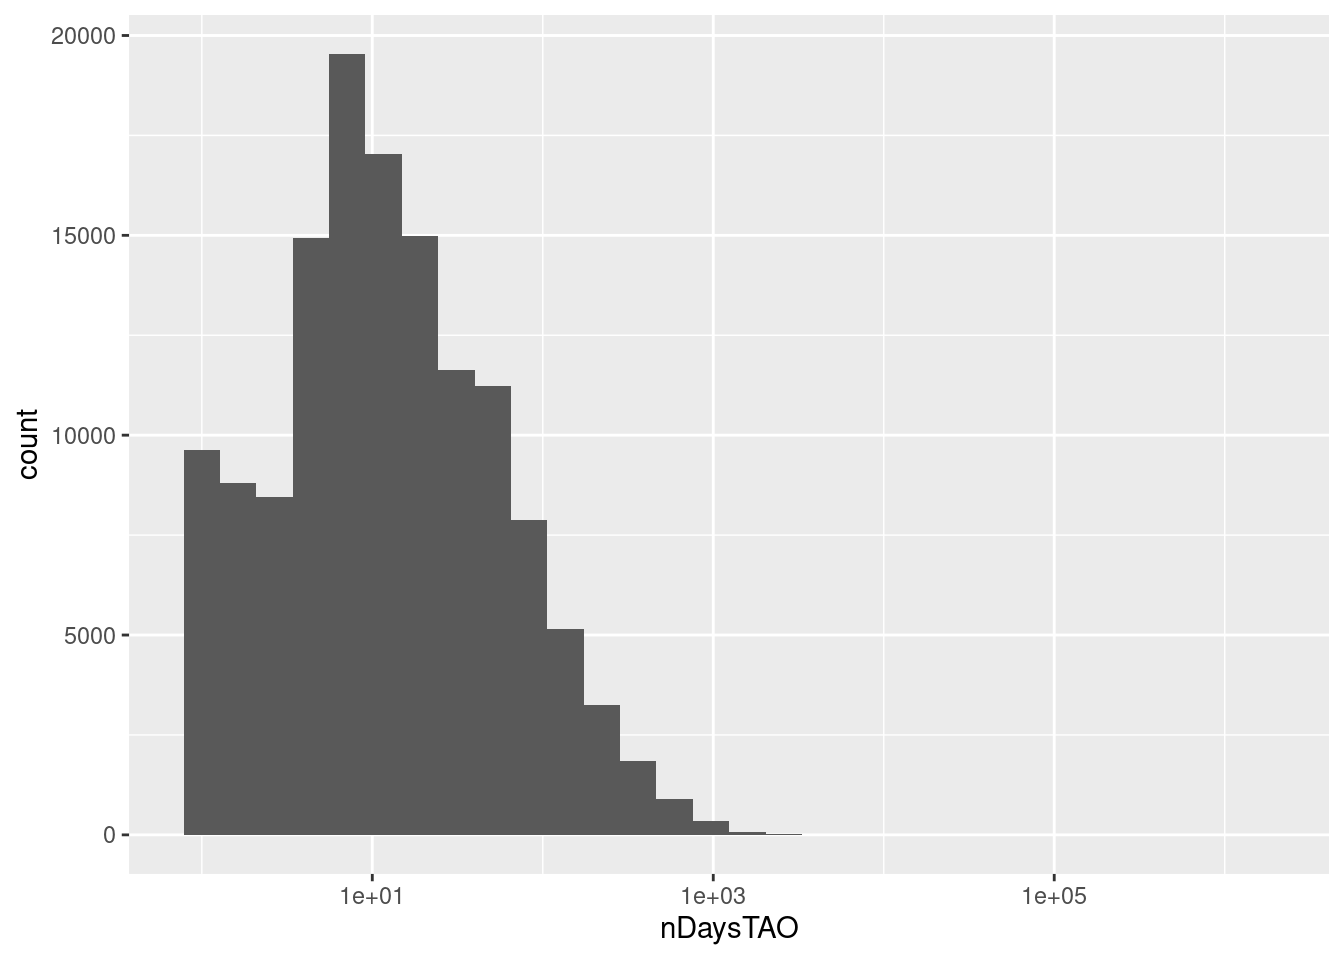
Data Quality Alert: the validated number of days lost variable appears to be of good quality
- data shows that -after validation- only 1122 (0.51%) of the notifications are missing a (validated) number of days lost
Summary on validated number of days lost: 50% notifications have values of 4 days (validated) or less (~0.5% is missing after correction)
- total number of validated notifications: 218034
- total number of validated notifications with missing validated number of days: 216912
- total number of validated notifications with missing validated number of days: 1122
- percentage of validated notifications with missing validated number of days: 0.51%
2.9 Data quality assessment of the Liantis processed accident records
In the subsequent phase of the data quality assessment, we focus on the notifications and their associated variables extracted from the FARAO-XML batches. When the Liantis automated extraction process encounters an error, the corresponding notification is recorded in the “error table.” Conversely, if the extraction is successful, the data are stored in the “occupational accidents table” of the operational database.
Two variables, INSZ number and CBE number, are crucial for this process. When mismatches for the same OA occur between these variables in the FARAO-XML batches and the Liantis database, the cases are excluded for further analysis. Mismatches occurred for:
After being stored in the Liantis operational database, the parsed notification fields may undergo further processing when new or additional information becomes available to Liantis ESPP colleagues. For example, validation checks may reveal that the codes used in the notification are not optimal for describing the OA, and that more suitable codes should be stored in the Liantis ESPP database record documenting the accident.
However, a key field required to determine the next operational steps for Liantis ESPP following receipt of the notification is initially missing. As shown in Section 2.8.4.2, the value found in the notifications under the XML tag <accidentSeriousness> consistently contains the value “UNDETERMINED”. This implies that all ESPP must independently assess the seriousness of the accident based on the information available in the original notification or in the validated and/or further processed fields of their operational database.
The key components of determination of seriousness are found in Figure 2.1 and are all present in the notifications and in the Liantis ESPP databases:
- OA happened during commuting
- circumstances of an OA happening at the workplace:
- sudden deviation
- last involved material agent
- consequences of the OA happening at the workplace in terms of incapacity:
- no damage
- temporary damage or permanent damage and if so, type of injury
- lethal damage
In order to help stakeholders in the determination of serioussness, the government and FEDRIS provide us with the ASR application. It’s documentation states “Declaration of Social Risk: Sector Occupational Accidents - Determine the severity of the accident and the resulting obligations”.
For use in the current project, the same decision rules were programmed in R code and applied to the original notification fields as well as to the Liantis database fields. Results of the comparison are presented in following concluding paragraph Section 2.10.
2.10 Conclusions about the potential of OA notification records
The different steps of the Extraction, Transformation and Loading (ETL) process of the notification dataset can be summarised as follows (all numbers are counts of notifications):
- all FEDRIS raw XML notifications between 2012-03-07 and 2024-12-24 345304 –> study period selection between 2014-01-01 and 2023-12-31 before validation 293929
- Validated FEDRIS notifications –> 218034
- Liantis raw database data –> 219095 (217931 with faonr, 1164 without faonr)
- parsed without errors 243981 –> study period cleaned 193761, final after left join 191959
- parsed with errors 42373 –> study period cleaned 25334, final after left join 25201
FedrisLiantisset left joined after validation 218034FedrisLiantisset both sides 217160 (with insznr and crbnr) and 874 “NA” (without insznr and crbnr)
| FALSE | TRUE | NA | |
|---|---|---|---|
| FALSE | 0 | 17 | 0 |
| TRUE | 197 | 216946 | 0 |
| NA | 0 | 0 | 874 |
Potential to use notifications as a proxy for occupational accidents
- Liantis ESPP received in the period of study 2014-2023 -through OAF notification messages via KSZ- information on 293938 unique raw OAF records, which cannot all be considered as linked to unique occupational accidents
- After validation, in cooperation with FEDRIS, the number of unique raw OAF records was reduced to 218034 (74.18%) unique validated OAF records; this last set of filtered records can be regarded as a validated set with information concerning unique occupational accidents
- After matching with the Liantis database and identifying 874 “NA” values for insznr and crbnr, 17 mismatches on INSZ number and 197 mismatches on CBE number, the number of unique OAF records was further reduced to 216946 (99.5% of unique validated OAF records); this is the selection of unique retained OAF records that will be used in further analysis in the present study
A summary can be found in Table 2.78. In this table, the data quality of the 216946 retained original FEDRIS notifications is compared with the data quality of the 216946 corresponding Liantis records. The table shows the number of missing values (“NA”, in which case it is not possible to test on equality), the number of equal values, and the number of not equal values for each variable. The percentage of missing values and the percentage of different values per variable are also calculated.
| variable | NA. | equal | not.equal | percna | percdiff |
|---|---|---|---|---|---|
| sex | 477 | 216469 | 0 | 0.22 | 0.00 |
| age | 885 | 216061 | 0 | 0.41 | 0.00 |
| place acc | 35185 | 181756 | 5 | 16.22 | 0.00 |
| postal code acc | 40858 | 175869 | 219 | 18.83 | 0.10 |
| nace5 code | 26883 | 176863 | 13200 | 12.39 | 6.08 |
| dateOA | 0 | 216944 | 2 | 0.00 | 0.00 |
| hourOA | 7721 | 209158 | 67 | 3.56 | 0.03 |
| commuting | 140576 | 76368 | 2 | 64.80 | 0.00 |
| inj body part | 0 | 215161 | 1785 | 0.00 | 0.82 |
| inj type | 0 | 213480 | 3466 | 0.00 | 1.60 |
| deviation | 0 | 212793 | 4153 | 0.00 | 1.91 |
| material agent | 0 | 212509 | 4437 | 0.00 | 2.05 |
| conseq acc | 79632 | 136302 | 1012 | 36.71 | 0.47 |
| est ndays lost | 832 | 209402 | 6712 | 0.38 | 3.09 |
| serious acc | 1270 | 207057 | 8619 | 0.59 | 3.97 |
| serious acc cor | 0 | 215677 | 1269 | 0.00 | 0.58 |
Since the table shows substantial differences in percentages, caution is needed when the different versions of the variable (validated notification version or database version) are used in analyses.
Data Quality Alert: beware of differences between validated notification and database fields
- the largest number of differences (6.1%) is found in the NACE-BEL-2008 Level 5 code of the employer
- smaller numbers of differences are seen in the codes describing the accident itself (0.8%-2.1%) such as injured body part, injury type, deviation and material agent; it could be further investigated what the origin of this difference is (new information within Liantis after last notification update, investigation on site, communication with empoyer…)
- a large discrepancy is found in the determination of seriousness: if we compare the determination on the validated notification with the original determination using the Liantis database (serious acc) the difference is much larger (4.0%) than if we compare with a redetermination (serious acc cor) using the commuting information from the notifications (0.6%); this difference can be explained by the implementation of the
WOONWERKfield in the operational flows (commuting OA -about 15% of all OA- are in juridical terms never to be considered as serious; not using this commuting information turns a part of normal commuting OA -wrongly- into serious OA) - in the further analyses, we will use the the variable serious acc cor: this combines potential expert judgement modifications from Liantis prevention advisors to the OA codes with the original commuting information from the notifications
An overview of the final number of retained notifications by source -either the OAs table or the error table- per year is presented in Figure 2.44. The figure clearly illustrates a marked decline in the number of cases recorded in the error table in 2020. This drop can be attributed to the implementation of the WOONWERK variable, which facilitated the successful processing of a greater number of cases into the OAs table.
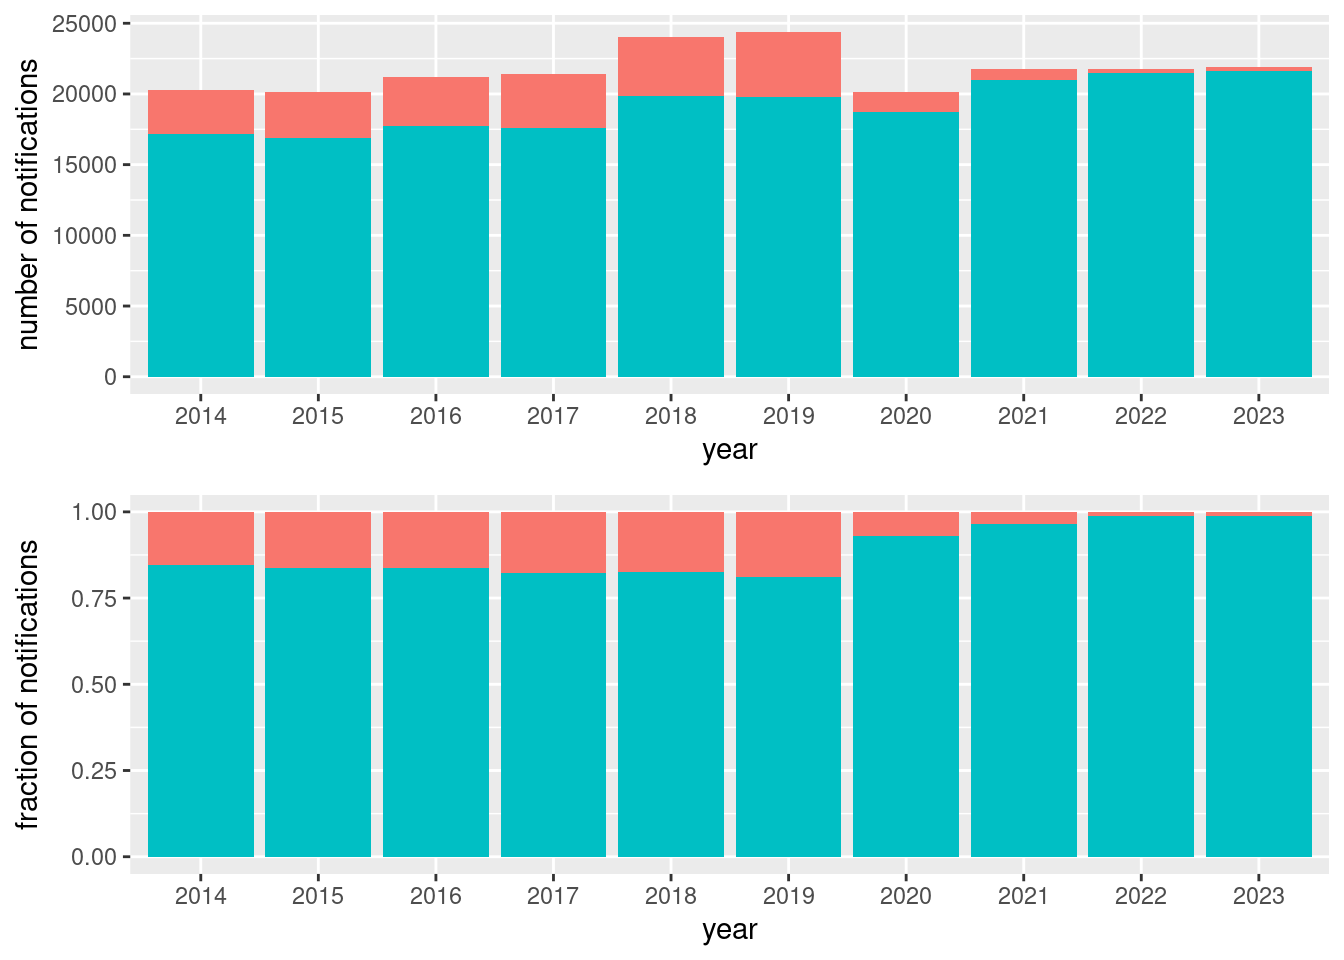
2.11 Data quality assessment of the Liantis ESPP risks
When employers become a customer of Liantis, prevention advisors of Liantis ESPP assess the different dangers and exposures in the workplace(s) of the employer and promptly assign ‘risks’ to the employees using an in house classification system. This assessment is repeated on a regular basis. The in house classification system was based on classification systems originally suggested by the government (Codex - Boek I - Titel 4 - Maatregelen in verband met het gezondheidstoezicht op de werknemers, BIJLAGE I.4-3 and Ministerieel besluit van 9 juni 2010 tot vaststelling van het model van jaarverslag van de externe diensten voor preventie en bescherming op het werk (BS 24/6/2010)). An illustration is shown in Figure 2.45.
In this classification system, risks are divided into different categories such as physical, chemical, biological, ergonomic, psychosocial,… risks. The classification code always exists of at least 3 groups of two digits separated by a dot.
Since risks of employees may change over time, all risks of all employees of all employers (69157 unique customers based on the different CBE numbers in the dataset) were extracted from the Liantis ESPP database in 120 separate blocks of one month between 2014 and 2023.
In the merged dataset, we found a total number of 6366894 assigned risks over 544 different risk codes for 1025682 unique employees in 46376 unique employers.
Since 544 is quite a large nummer, further grouping is required for reporting. We grouped the risk codes based on the original main xx and sub xx.xx codes of the Liantis system, but also on a new grouping implemented due to changes in the health assessment form (FOD WASO).
Risk codes that do not require a periodic medical examination were identified and manually added in a new grouping variable RISKGROUPext in order to be able to group and report on all risks found in the ten-year dataset. Details on the number of assigned risks following this last expert judgement grouping are found in in Table 2.79.
| RISKGROUPext | n | perc |
|---|---|---|
| Biological agents | 1025318 | 16.1 |
| Ergonomic risks | 916112 | 14.4 |
| Vaccinations | 770711 | 12.1 |
| Screen work | 546005 | 8.6 |
| Safety function | 525495 | 8.3 |
| Food and horeca | 465796 | 7.3 |
| Fysical agents: noise | 276793 | 4.3 |
| Chemical agents: solvents | 232836 | 3.7 |
| Chemical agents: detergents | 214821 | 3.4 |
| Night- and shiftwork | 202206 | 3.2 |
| Psychosocial risks: other | 132262 | 2.1 |
| Fysical agents: vibrations | 102845 | 1.6 |
| Chemical agents: dusts and fibers | 94963 | 1.5 |
| Other workers | 93281 | 1.5 |
| Chemical agents: other | 88179 | 1.4 |
| Chemical agents: carcinogenic, mutagenic and reprotoxic | 74648 | 1.2 |
| Chemical agents: organic material | 68046 | 1.1 |
| Fysical agents: thermal factors | 71816 | 1.1 |
| Lactation and pregnancy | 70883 | 1.1 |
| Chemical agents: metals | 55581 | 0.9 |
| Psychosocial risks: agression | 51694 | 0.8 |
| Special workers | 49632 | 0.8 |
| Chemical agents: welding fume | 39302 | 0.6 |
| Fysical agents: artifical optical radiation | 38824 | 0.6 |
| Chemical agents: burns | 29740 | 0.5 |
| Chemical agents: pharmaceuticals | 16899 | 0.3 |
| Fysical agents: ionizing radiation | 20430 | 0.3 |
| Increased alertness | 18065 | 0.3 |
| Risk to determine | 21770 | 0.3 |
| Chemical agents: colorants | 13598 | 0.2 |
| Chemical agents: intoxication | 9110 | 0.1 |
| Chemical agents: pesticides | 8390 | 0.1 |
| Fysical agents: electromagnetic fields | 6975 | 0.1 |
| Fysical agents: hyperbaric environment | 6452 | 0.1 |
| Activity with specific risk | 2305 | 0.0 |
| Chemical agents: noble gasses | 440 | 0.0 |
| Chemical agents: sensitization | 946 | 0.0 |
| Fitness to drive | 461 | 0.0 |
| Fysical agents: other | 2604 | 0.0 |
| Fysical agents: skin risks | 660 | 0.0 |
In the top six of the most frequently assigned risks, we find next to biological agents, ergonomic risks and safety functions, vaccinations, screen work and food and horeca. Assigned vaccinations will often be combined with risks due to biological agents, and in hospitals for example, many different etiological agents will occur at the same time at the same place, leading to multiple assigned codes for a same worker.
Risks for reporting about risks
It has to be stressed that within groups like e.g. biological agents, many different specified agents co-occur, leading to multiple assigned codes for a same worker and a potentially distorted view on the weight of -in this example- biological risks if only code frequencies are reported. Making frequency based risk comparisons between groups like biological agents, ergonomic risks, safety functions, vaccinations, screen work,… is therefore not recommended.
Summary Liantis risks ten-year dataset: many risks occur and co-occur
- total number of Liantis risks in the ten-year dataset: 6366894
- total number of unique employers in the ten-year dataset: 46376
- total number of unique employees in the ten-year dataset: 1025682
- total number of unique codes in the ten-year dataset: 544
- total number of code groups (expert judgement) in the ten-year dataset: 40
2.12 Data quality assessment of the Liantis ESPP time invested in prevention
All timeregistrations of all Liantis ESPP colleagues between 2013-01-01 and 2024-12-31 were extracted from the Liantis ESPP operational database. We started with filtering for registrations with a date Datum between 2013-01-01 and 2023-12-31. We kept registrations up to one year before the first day of the study period in order to be able to use information for investments in prevention in the rolling twelve months preceding a (potential) OA.
Registrations linked to employers are kept and timeregistrations during holiday time are filtered out. The codes are classified into four categories: “general” (not linked to safety or prevention services), “service” (linked to prevention services but not to safety) and “safety” (linked to prevention services and to safety), the latter being split into two categories (whether codes are explicitly linked to advice and service post occurrence of an OA or not).
The following Table 2.80 summarizes the retained information concerning the number and length of timeregistrations (linked to specific employers) by category (general, service or safety).
| cattime | hour | nregist | perctime | percregist |
|---|---|---|---|---|
| general | 1335996.93 | 746984 | 57.33 | 43.61 |
| service | 717123.00 | 824725 | 30.78 | 48.15 |
| safety not post OA | 235173.02 | 111923 | 10.09 | 6.53 |
| safety post OA | 41896.78 | 29321 | 1.80 | 1.71 |
Summary Liantis timeregistrations ten-year dataset
- total number of Liantis timeregistrations in the ten-year dataset: 1712953
- total hours of Liantis timeregistrations in the ten-year dataset: 2.3301897^{6}
- percentage registrations: general 43.61%, service 48.15%, safety not post OA 6.53%, safety post OA 1.71%
- percentage hours: general 57.33%, service 30.78%, safety not post OA 10.09%, safety post OA 1.8%
After classification into these categories for all employers together, we can summarize the time per year, month and employer in these three categories. Subsequently, we calculated the lagged values of the time spent in each category, which can be useful for further analysis, in different time frames (previous month, quarter, semester and year).
2.13 Data quality assessment of the Liantis ESPP audiometry data
During the medical prevention consults it is under certain circumstances possible that Liantis ESPP conducts audiometric testing of an employee. The results of these audiometric tests are stored in the Liantis ESPP database.
In 14 different variables (7 for the left ear, 7 for the right ear), the hearing thresholds in dB at 500, 1000, 2000, 3000, 4000, 6000 and 8000 Hz are recorded
When a difference of >10 dB of the hearing threshold between two consecutive frequencies within a same ear is observed, we flag this as an audiometric test for which a so called “noise dip” can be detected. Since noise dips are often associated with (the beginning of) noise-induced hearing loss, the parameter can be considered clinically relevant. Since the measurement error of a classic audiometric test which is typically between 5 and 10 dB, which is lower, the parameter is less sensitive for differences between and within devices and operators. See Table 2.81 for an overview.
| noisedip | n | freq |
|---|---|---|
| 0 | 196338 | 31.48 |
| 1 | 427375 | 68.52 |
Between 2014-01-02 and 2023-12-29, 623713 audiometric tests were performed in 465466 unique employees from 24200 unique employers by Liantis ESPP employer number. In 427375 tests (or 68.52%) a noise dip could be detected.
Summary Liantis ESPP audiometric test results 2014 - 2023: noise dips occur in 7/10 tests
- total number of unique employees undergoing an audiometric test between 2014 and 2023: 465466
- total number of audiometric tests between 2014 and 2023: 623713
- total number (percentage) of tests in which a noise dip was detected: 427375 (68.52%)
Data Quality Alert: results from a non-representative sample of employees
The data quality of the audiometric test results (a binary variable indicating whether a noise dip is present or not) seems good. However, we should keep in mind that after initial testing, in general only employees with assigned risks related to noise exposure qualify for follow up audiometric testing during a medical prevention consult. Thus, the results will not be representative of the entire working population within (or outside) Liantis customers through the whole ten year period of the study.
For modelling in the data analysis part of the study, only data from employees from mutual customers can be used, further reducing the number of cases that can be included by 70%.
2.14 Data quality assessment of the Liantis ESPP general medical questionnaire (subset 2022 - 2023)
Liantis ESPP uses a General Medical Questionnaire (AMV in Dutch) (GMQ) in its procedure of a medical prevention consult. The questionnaire can be filled out prior to the medical examination and implies self-reporting but has the advantage that every respondent can (negatively or positively) validate a standardised set of questions. Through the GMQ, all people invited for a medical prevention consult get the opportunity to share information concerning:
- general health (“How do you generally assess your own health over the past 12 months?”)
- bad hearing (“Over the past 12 months, how long in total have you suffered from hearing impairment (more difficulty in having a conversation in a quiet space)?”)
- sleep problems (“How long in total have you experienced sleeping problems (such as difficulty falling asleep, restless sleep, sleep apnea,…) over the past 12 months?”)
- substance abuse
- drugs
- medication (heavy painkillers, sedatives, tranquillisers or antidepressants)
- alcohol
- smoking
- general satisfaction (“About your job in general: how satisfied are you with your job as a whole?”)
Data from the most recent version of the GMQ were recovered from medical examinations between 2022-03-28 and 2023-12-29.
Table 2.82 shows the general health status of employees completing the GMQ in 2022 and 2023.
| GENHEALTH | n | perc |
|---|---|---|
| Bad | 3159 | 1.84 |
| Reasonable | 21276 | 12.41 |
| Good | 75626 | 44.10 |
| Very good | 55467 | 32.35 |
| Excellent | 15957 | 9.31 |
Table 2.83 shows the prevalence of bad hearing among employees completing the GMQ in 2022 and 2023.
| BADHEARING | n | perc |
|---|---|---|
| 0 days | 162421 | 94.71 |
| < 1 week | 2935 | 1.71 |
| 1 week - 1 month | 1493 | 0.87 |
| 1 month - 3 months | 624 | 0.36 |
| > 3 months | 4012 | 2.34 |
Table 3.60 shows the prevalence of sleep problems among employees completing the GMQ in 2022 and 2023.
| SLEEP | n | perc |
|---|---|---|
| 0 days | 96699 | 56.39 |
| < 1 week | 24898 | 14.52 |
| 1 week - 1 month | 19004 | 11.08 |
| 1 month - 3 months | 9876 | 5.76 |
| > 3 months | 21008 | 12.25 |
Table 3.62 shows the prevalence of drug use among employees completing the GMQ in 2022 and 2023.
| DRUGS | n | perc |
|---|---|---|
| No | 166375 | 97.02 |
| Occasionally | 3212 | 1.87 |
| Every day | 492 | 0.29 |
| I do not wish to answer | 1406 | 0.82 |
Table 3.63 shows the prevalence of medication use among employees completing the GMQ in 2022 and 2023.
| MEDICATION | n | perc |
|---|---|---|
| No | 147469 | 86.00 |
| Occasionally | 14265 | 8.32 |
| Every day | 8574 | 5.00 |
| I do not wish to answer | 1177 | 0.69 |
Table 3.61 shows the prevalence of alcohol use among employees completing the GMQ in 2022 and 2023.
| ALCOHOL | n | perc |
|---|---|---|
| No | 65525 | 38.21 |
| <= 5 glasses a week | 75113 | 43.80 |
| 6 - 10 glasses a week | 20941 | 12.21 |
| 11 - 20 glasses a week | 4731 | 2.76 |
| > 20 glasses a week | 974 | 0.57 |
| I do not wish to answer | 4201 | 2.45 |
Table 2.88 shows the prevalence of smoking among employees completing the GMQ in 2022 and 2023.
| SMOKING | n | perc |
|---|---|---|
| No | 121125 | 70.63 |
| Occasionally | 12451 | 7.26 |
| Every day | 36419 | 21.24 |
| I do not wish to answer | 1490 | 0.87 |
- total number of filled out GMQ from Liantis ESPP only customers in 2022 and 2023: 171485
- most people rate their general health as good (44.1%)
- most people have 0 days with complaints due to bad hearing (94.71%)
- most people have 0 days with sleep problems (56.39%)
- most people do not use drugs (97.02%)
- most people do not use medication (86%)
- most people drink <= 5 glasses a week (82.01%) but our percentage heavy drinkers (> 10 glasses a week, 3.33%) is much lower than in the general Flemish population (15.3% in 2023-2024 according to statistiek Vlaanderen)
- most people do not smoke (70.63%) but our percentage daily and occasional smokers (28.5%) is higher than the general Flemish population (15.9% in 2024 according to statistiek Vlaanderen)
- total number of filled out GMQ from Liantis ESPP and PS mutual customers in 2022 and 2023: 58875 (34.33% of total)
Data Quality Alert: self-report from a non-representative sample of employees for a subperiod of the study
The data quality of the GMQ responses seems good at first sight, but we should not forget that GMQ responses indicate self-reported health during the period from March 2022 to December 2023, less than two out of ten years of the study. Moreover, only employees with assigned risks qualifying for a medical prevention consult are invited to fill out the questionnaire. Thus, the results will not be representative of the entire working population within (or outside) Liantis customers through the whole ten year period of the study and can as such not be compared with numbers from e.g. Statistiek Vlaanderen.
For modelling in the data analysis part of the study, only data from employees from mutual customers can be used, further reducing the number of cases that can be included by 66%.
2.15 Data quality assessment of the Liantis ESPP Personal Protective Equipment (PPE) data
In the Liantis ESPP electronic medical dossier of the worker, the availability and use of PPE can be evaluated. To accomplish this, one must first select the PPE to be evaluated for the employer or employee from an exhaustive list.
PPE evaluations are always linked to one or more risks (see Section 2.11) a worker experiences with his employer.
During a medical examination, PPE can be evaluated whether it is available (Yes/No) and whether the employee uses it (Yes/No/Sometimes).
When a PPE is evaluated, the “Last Evaluation Date” is updated. These 169431 PPE evaluations concern 47447 employees and 4875 unique employers. Over the period 2008–2025, this is a relatively small number of evaluations. The number of evaluations per employer ranges from 1 to 4842.
We examine the number of most recent evaluations over time. For the vast majority of employees, only one or a few PPEs are evaluated. Figure 2.46 shows the trend in the number of unique employees with PPE use evaluated over time.
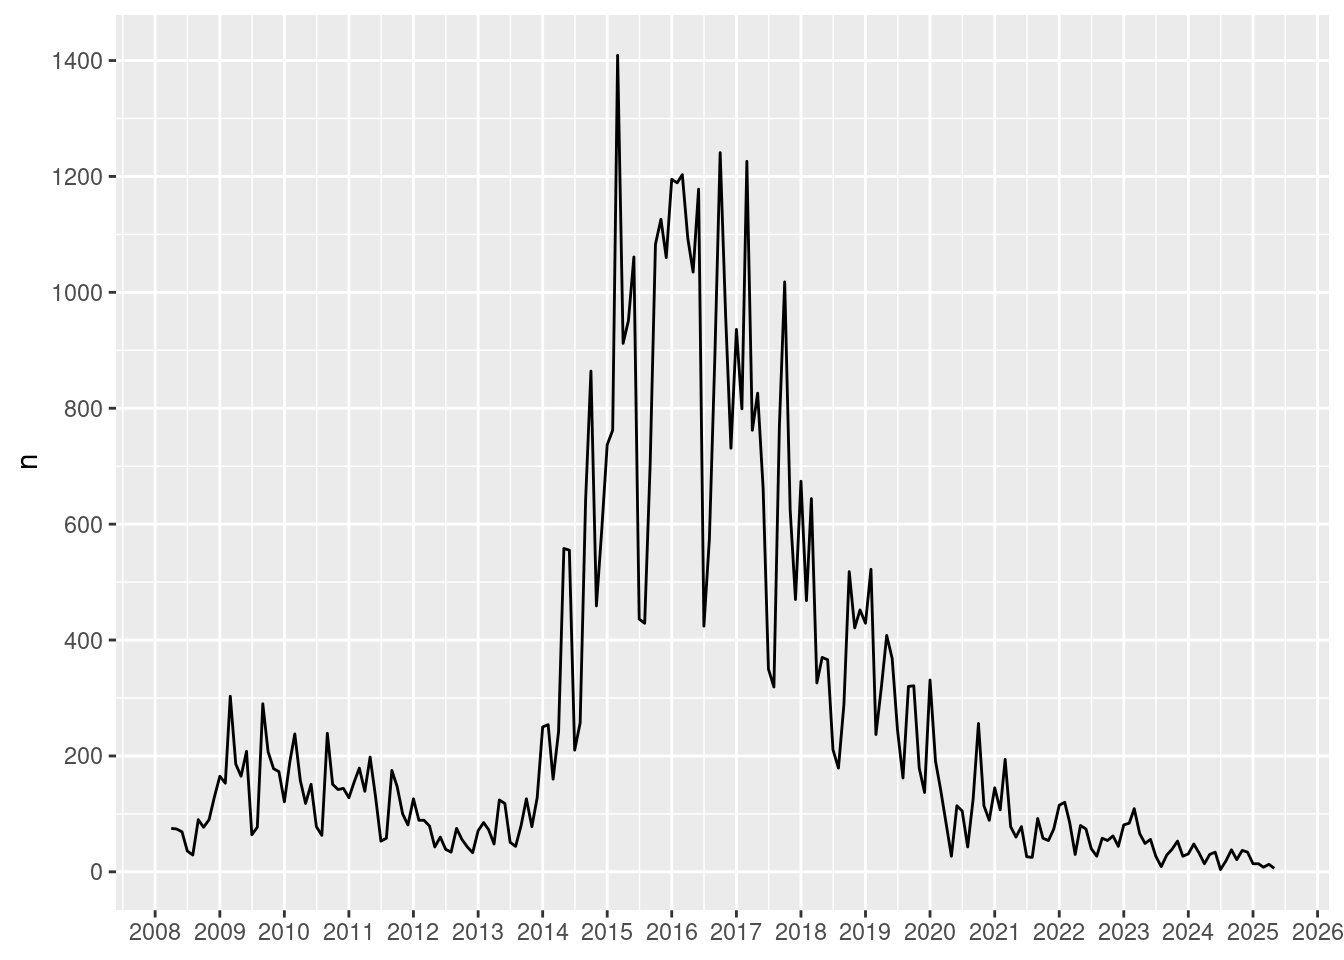
We observe that most evaluations occurred between 2015 and 2019.
To indicate the relative importance of the PPE evaluations, we can compare the number of unique workers with PPE evaluated per month with the number of unique employees with risks per month. The result is shown in Figure 2.47. At maximum pace, only 1% of employees with risks per month have been evaluated fore PPE via this electronic medical dossier route.
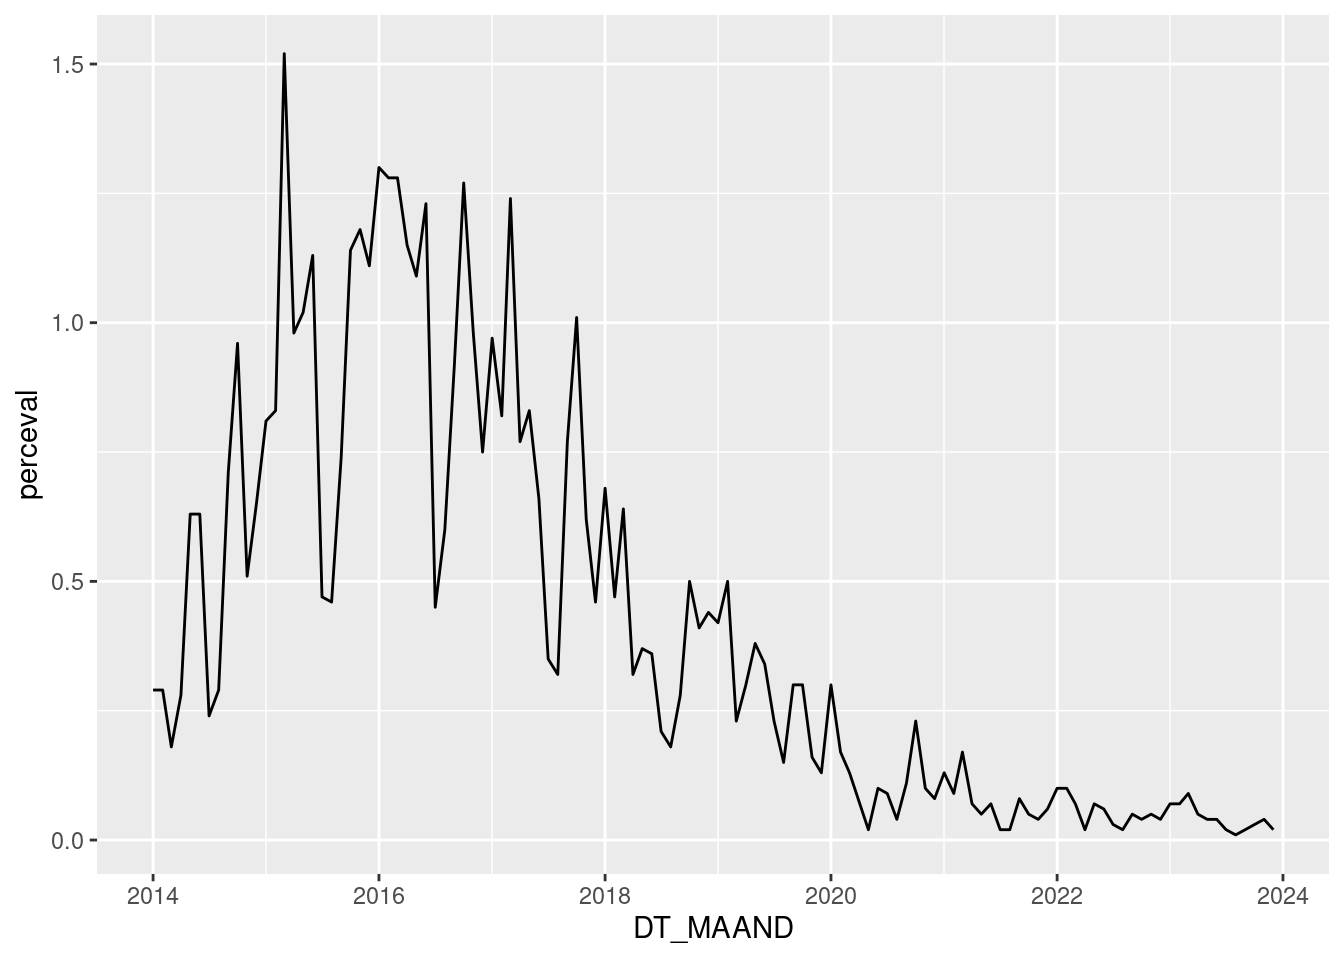
To assess the impact of PPE usage (or lack thereof) on OAs, we need a large amount of longitinal data, both from employees who have had an OA and those who have not had an OA.
The fact that we do not have longitudinal data -only evaluations valid at the time of the “Last Evaluation Date”- renders the data unusable: it only reflects that specific moment (and presumably the immediate surrounding period).
Given the limited data, the lack of longitudinal tracking, the uneven distribution in time and other data quality issues, linking the Liantis ESPP PPE evaluation data to occupational accidents would provide a very limited and potentially misleading picture considering the small number of employees for whom structured data is available.
2.16 Data quality assessment of the Liantis PS processed employee signalitic data (subset mutual customers)
As described on the website of the Belgian Federal Government Internal Affairs Department signalitic data are variables that are common to all persons in the National Register of Natural Persons, including those included in the waiting register. These are the following (see article 3, first paragraph, of the law of 8 August 1983):
- name and first names,
- place and
- date of birth
- biological sex
- nationality
- main residence
- place and date of death
- profession
- marital status
- composition of the family
- mention of the register in which the person concerned is registered
- administrative status of the persons referred to in Article 2, first paragraph, 3°, namely asylum seekers
- if applicable, the existence of the identity and signature certificate
- legal cohabitation
- residence status for foreigners
Lists of employees with signalitic data from mutual Liantis ESPP and PS customers per month between January 2014 and December 2023 were exported in csv format by using an operational reporting tool.
In Table 2.89 is displayed how many employees with signalitics information are known in the subset of mutual customers of Liantis ESPP and PS, summed over twelve months for each of the ten years in the study.
| year | totpersj |
|---|---|
| 2014 | 1408504 |
| 2015 | 1503562 |
| 2016 | 1528951 |
| 2017 | 1623867 |
| 2018 | 1706951 |
| 2019 | 1802380 |
| 2020 | 1810260 |
| 2021 | 1920823 |
| 2022 | 2131347 |
| 2023 | 2374449 |
The monthly evolution is shown in Figure 2.48.
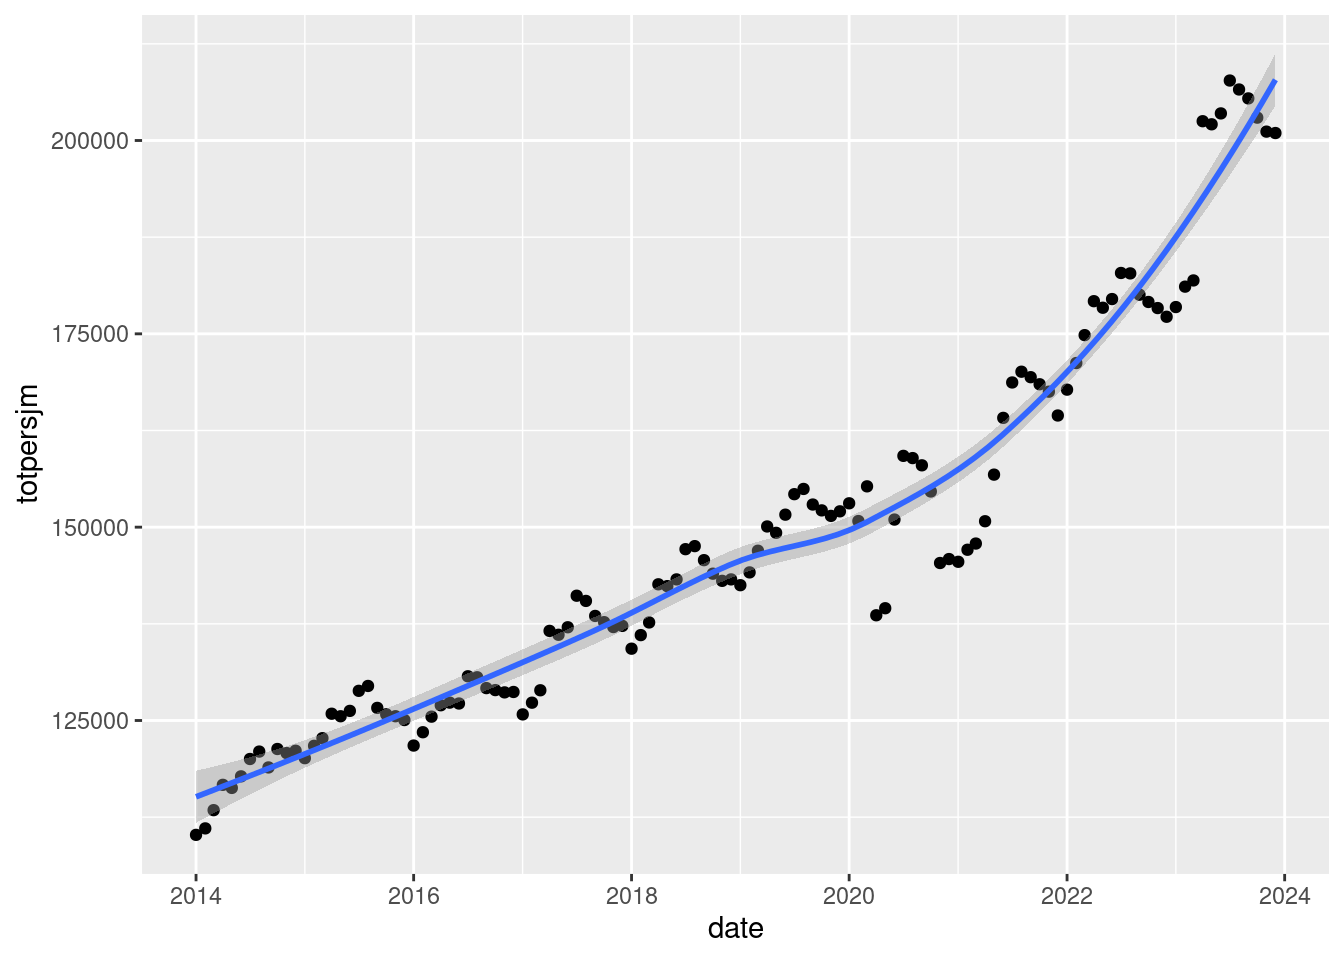
Summary number of workers with signalitics: 82% growth over the study period
- total number of unique individuals: 692190
- total number of individuals with signalitic information january 2014: 110208
- total number of individuals with signalitic information december 2023: 200968
- percentage increase in total number of individuals with signalitic information between january 2014 and december 2023: 82.35
2.17 Data quality assessment of the Liantis PS processed employee calendar codes (subset mutual customers)
2.17.1 Number of workers effectively at work
Lists of effective hours worked per contract agreement (+ gross salary) per employee from mutual Liantis ESPP and PS customers per month between January 2014 and December 2023 were exported in csv format by using an operational reporting tool. Starting from this dataset, the number of employees with their total number of effectively worked and paid hours per mutual Liantis ESPP and PS customer employer per year and month could be calculated. This subset is the dataset to be used further in the project.
In Table 2.90 is displayed how many employees with wage calculations are known in the subset of 47820 mutual customers of Liantis ESPP and PS, summed over twelve months for each of the ten years in the study. The result of the division by the number of employees with signalitics information is also shown. Since the result is >1 we may conclude that more wage calculations per individidual are made than there is signalitics information per individual available.
| year | totpersjwage | totpersjsig | fracwagesig |
|---|---|---|---|
| 2014 | 1555064 | 1408504 | 1.10 |
| 2015 | 1926283 | 1503562 | 1.28 |
| 2016 | 1986499 | 1528951 | 1.30 |
| 2017 | 2047550 | 1623867 | 1.26 |
| 2018 | 2128877 | 1706951 | 1.25 |
| 2019 | 2202131 | 1802380 | 1.22 |
| 2020 | 2193645 | 1810260 | 1.21 |
| 2021 | 2311355 | 1920823 | 1.20 |
| 2022 | 2498904 | 2131347 | 1.17 |
| 2023 | 2559641 | 2374449 | 1.08 |
The monthly evolution is shown in Figure 2.49.
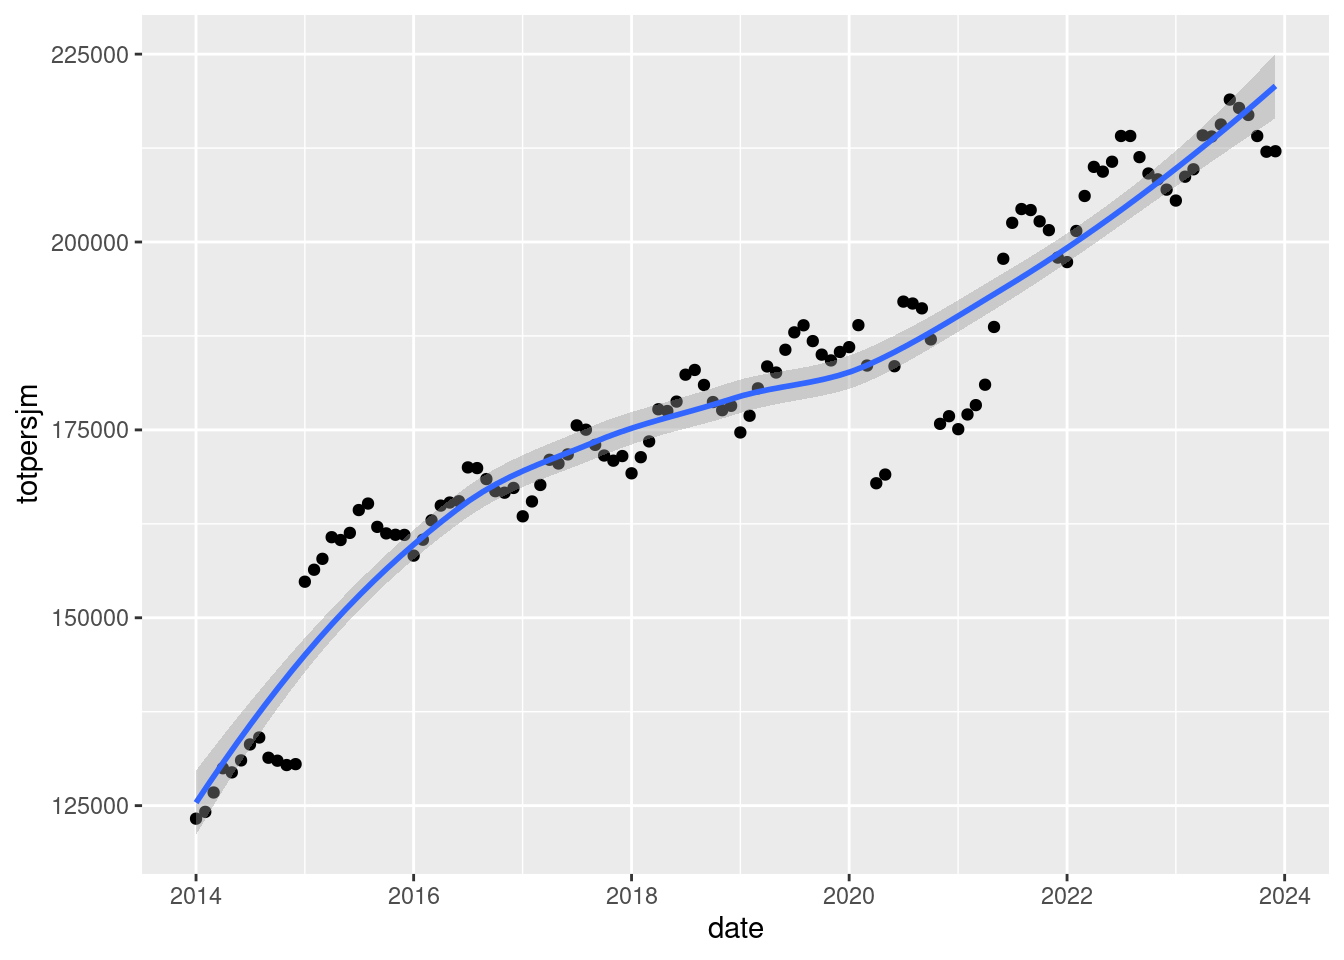
Data Quality Alert: number of workers effectively at work
- we use wage calculations from workers with effectively paid working hours to identify the number of workers in the mutual Liantis ESPP and PS employers; this is a subset (wage code property code LCE6) for effectively paid working hours and thus seems a good basis to determine risk exposure in terms of number of people effectively at work
- government and FEDRIS documentation state they use data from the Déclaration multifonctionelle / multifunctionele Aangifte (DmfA) to calculate the number of workers at work (which would mean that data is collected at a quarterly level each three months, including pregnancies, holidays, long term sickness,…); in our opinion this might result in an overestimation of the number of workers effectively at work and thus an overestimation of the risk exposure in terms of number of people effectively at work
Summary number of workers effectively at work: 72% growth over the study period
- total number of mutual customers: 47820
- total number of wage calculations january 2014: 123263
- total number of wage calculations december 2023: 212079
- percentage increase in total number of wage calculations between january 2014 and december 2023: 72.05
2.17.2 Effective labour hours worked
The subset already discussed and used in the preceding section not only contains the number of people per employer per month, but also the number of effectively worked and paid hours per employer per month.
In Table 2.91 is displayed how many worked hours for workers with wage calculations are known in the subset of 47820 mutual customers of Liantis ESPP and PS, summed over twelve months for each of the ten years in the study.
| year | tothjm |
|---|---|
| 2014 | 140313234 |
| 2015 | 170783015 |
| 2016 | 175580273 |
| 2017 | 179661580 |
| 2018 | 187012858 |
| 2019 | 192391203 |
| 2020 | 181174668 |
| 2021 | 198670974 |
| 2022 | 213952939 |
| 2023 | 219721056 |
The monthly evolution is shown in Figure 2.50.
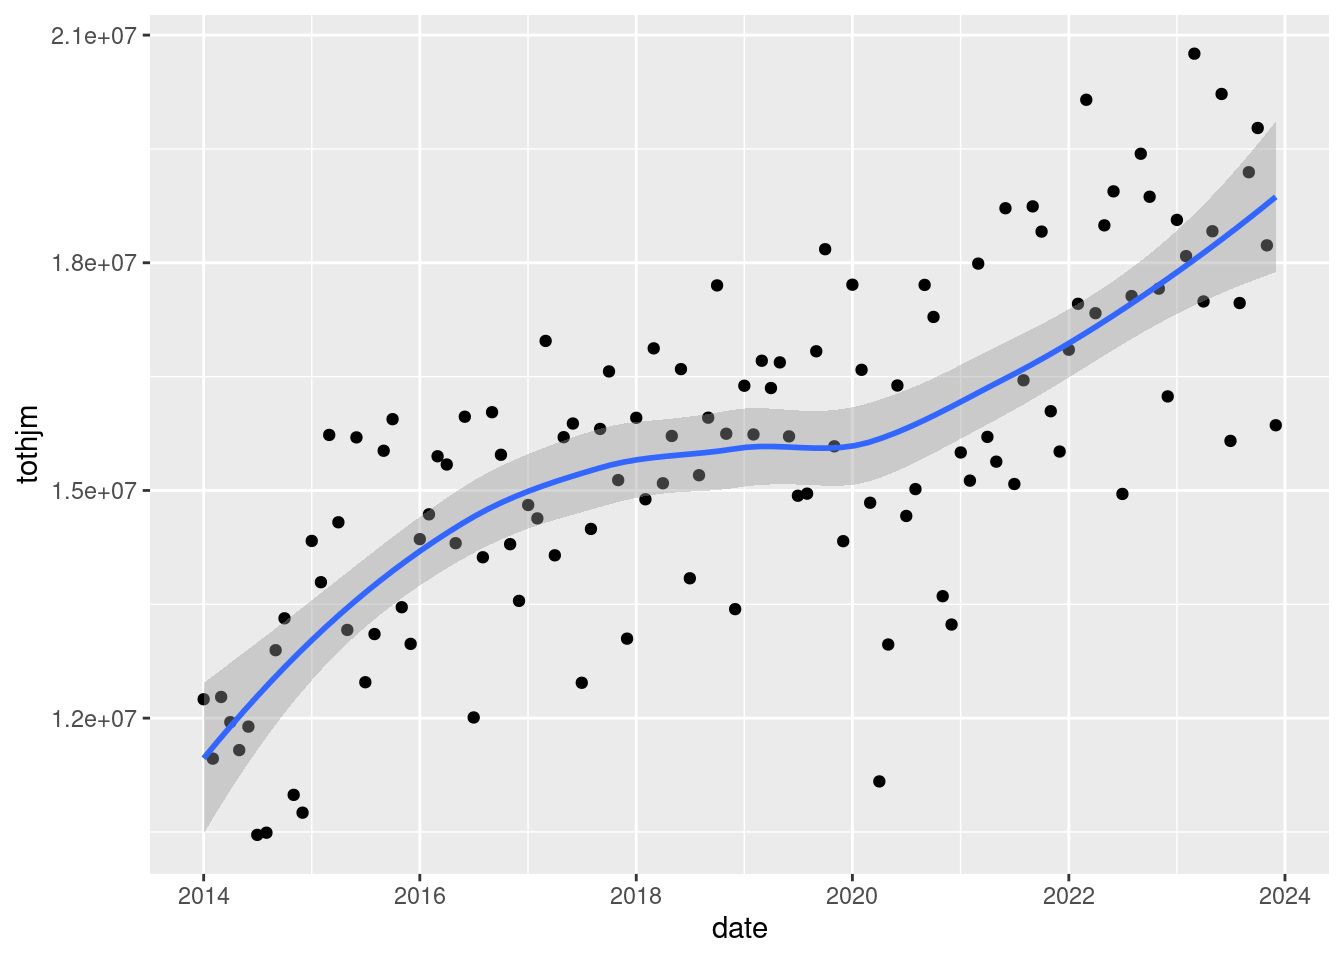
Data Quality Alert: number of hours effectively worked
- we use wage calculations from workers with effectively paid working hours to identify the number of workers in the mutual Liantis ESPP and PS employers; this is a subset (wage code property code LCE6) for effectively paid working hours and thus seems a good basis to determine risk exposure in terms of number of hours worked by people effectively at work
- government and FEDRIS documentation state they use data from the DmfA to calculate the number of workers at work (which would mean that data is collected at a quarterly level each three months, including pregnancies, holidays, long term sickness,…); in our opinion this might result in an overestimation of the number of hours worked by workers effectively at work and thus an overestimation of the risk exposure in terms of number of hours effectively worked
Summary number of hours worked: 29% growth over the study period
- total number of mutual customers: 47820
- total number of worked hours january 2014: 12248780
- total number of worked hours december 2023: 15859257
- percentage increase in total number of wage calculations between january 2014 and december 2023: 29.48%
2.17.3 Effective labour hours lost due to occupational accidents
Lists of effective time and wage losses due to an OA (hours, wage and patronal charge for PS codes linked to OA) per employee from mutual Liantis ESPP and PS customers per semester for the years 2014 to 2023 were exported in csv format by using an operational reporting tool. The 24 lists were separately stored and bound together per year.
In Table 2.92 is displayed how many hours employees with wage calculations were absent due to an OA in the subset of 0 mutual customers of Liantis ESPP and PS, summed over twelve months for each of the ten years in the study.
| jaar | tothj |
|---|---|
| 2014 | 732676.4 |
| 2015 | 854906.8 |
| 2016 | 890174.5 |
| 2017 | 941943.6 |
| 2018 | 913534.4 |
| 2019 | 930813.8 |
| 2020 | 909149.1 |
| 2021 | 1012520.5 |
| 2022 | 957504.2 |
| 2023 | 1004885.5 |
The monthly evolution is shown in Figure 2.51.
Summary number of hours lost: 36% growth over the study period
- total number of hours lost january 2014: 59508
- total number of hours lost december 2023: 80875
- percentage increase in total number of hours lost between january 2014 and december 2023: 35.91%
2.17.4 Effective wage for number of labour hours worked
The subset already discussed and used in the preceding section not only contains the number of people per employer per month, but also paid wages or worked hours per employer per month.
In Table 2.93 is displayed which total amount was paid for workers with wage calculations known in the subset of 47820 mutual customers of Liantis ESPP and PS, summed over twelve months for each of the ten years in the study.
| year | totwjm |
|---|---|
| 2014 | 3039027846 |
| 2015 | 3659795056 |
| 2016 | 3804467657 |
| 2017 | 3987232375 |
| 2018 | 4231274309 |
| 2019 | 4430360268 |
| 2020 | 4323169826 |
| 2021 | 4770945544 |
| 2022 | 5383131303 |
| 2023 | 5932275517 |
The monthly evolution is shown in Figure 2.52. The two outliers each year represent June and December where the holiday pay and end of year premiums are often paid. The single outlier in March 2020 reflects the effect of the lockdown due to the COVID-19 pandemic, which resulted in a significant reduction in paid wages.
Summary amount effective wage paid: 188% growth over the study period
- total number of mutual customers: 47820
- total amount paid january 2014: 234730255
- total amount december 2023: 677158023
- percentage increase in amounts paid between january 2014 and december 2023: 188.48%
2.17.5 Effective wage lost for number of labour hours lost
The subset already discussed and used in the preceding section not only contains the number of labour hours lost due to OAs per employer per month, but also the amount of wage lost per employer per month.
In Table 2.94 is displayed which wage amounts were lost due to an OA in the subset of mutual customers of Liantis ESPP and PS, summed over twelve months for each of the ten years in the study.
| jaar | totwj |
|---|---|
| 2014 | 4763039 |
| 2015 | 5460254 |
| 2016 | 5785565 |
| 2017 | 5831288 |
| 2018 | 5795738 |
| 2019 | 5866233 |
| 2020 | 5270210 |
| 2021 | 6291465 |
| 2022 | 6472399 |
| 2023 | 7172894 |
The monthly evolution is shown in Figure 2.53.
Summary amount effective wage lost for number of worked hours lost: 66% growth over the study period
- total amount of wage lost january 2014: €357681
- total amount of wage lost december 2023: €593746
- percentage increase in total amount of wage lost between january 2014 and december 2023: 66%
2.17.6 Merged individual datasets
To be able to calculate the chance that an individual notifies an OA in a certain month of a certain year, it is essential to start from all paid workers working for Liantis PS and ESPP mutual customers in a certain month and year.
These merged yearly datasets were built in several steps.
Briefly, the process can be summarised as follows:
- start with all signalitic data for a specific year from 12 monthly files on individual employee level and build yearly signalitic datasets containing all months (see Section 2.16)
- clean up all (valid) duplicates of individual signalitic data (multiple valid contract and wage combinations, variants of profession, marital status, language of the worker,…) in a yearly file containing all months
- build yearly datasets with wages and costs on individual employee level in a yearly file containing all months (see Section 2.17.2 and Section 2.17.3)
- left join individual wages and costs from yearly files to the cleaned signalitic data by year and month, the combination of office, dossier, personnel number and contract number and dates of beginning and end of the contract
- clean up all (valid) duplicates of individual wage and cost data (multiple contracts, contract durations, dates of beginning and end of the contract, days and hours worked and paid, registrations on OA wage codes, amounts of effective and patronal wage components related to OA wage codes, numerators, denominators and derived employment quotients, profession, statute, substatute, country of birth, postal code,…)
- load dataset with employer properties, clean up all (valid) duplicates on collective employer level (multiple juridical forms, names, postal codes, countries, languages, sectors, joint labour committees,…) (see Section 2.3.2)
- left join company information to the individual employee data
- load OA data from the validated and cleaned FEDRIS notifications and left join employer data to the notifications, filter on a single year from 2014 to 2023 (see Section 2.10 and Section 2.3.4)
- left join the OA data subset by “year”,“month”,“crbnr” and “insz” to the merged dataset and determine on individual monthly level whether an OA was notified on a date in that month (‘hadOA’ variable) and save the final merged dataset as a “mergedYYYY” RDS file
The final merged dataset contains all the information needed to calculate the chance of notifying an OA for each individual worker in a certain month and year.
2.17.7 FEDRIS external reference for the number of workers, frequency and severity degree (company level)
FEDRIS publishes yearly a series of statistics on the number of workers, frequency and severity degrees concerning OAs for all Belgian employers in the private sector (and public sector). These statistics are available on the FEDRIS website and can be downloaded as Microsoft Excel .xlsx files free of charge from the “statistisch jaarverslag” page. An example is shown in Figure 2.54.
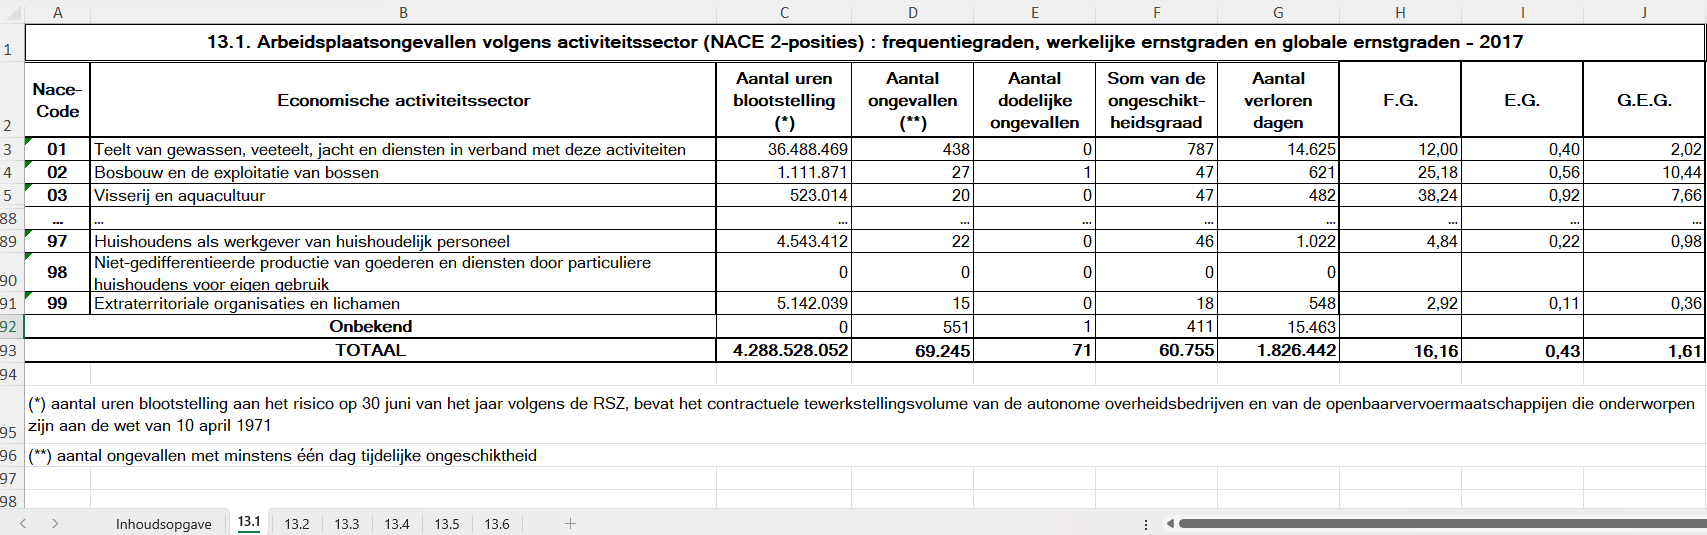
FEDRIS also summarises the information from these .xlsx files in “sectorfiches” which are also available free of charge. An example is shown in Figure 2.55.
All .xlsx files and “sectorfiches” from the study period 2014 to 2023 were consulted and some important numbers were extracted from them as external references. The result is shown in Table 2.95. The different variables are:
- year: the year of the statistics
- nemployers: the number of employers “aantal werkgevers” per year in the private sector from the “sectorfiche” (see Figure 2.55)
- nfte: the number of FTE workers “aantal werknemers (VTE)” per year in the private sector from the “sectorfiche” (see Figure 2.55)
- nhexpcalc: number of hours exposure calculated with the rule of thumb mentioned on the FEDRIS website (nfte multiplied with 7.6 times 229)
- nhexprsz: number of hours exposure provided by NSSO to FEDRIS (.xlsx file theme 13 tab 13.1 “TOTAAL, Aantal uren blootstelling”, see Figure 2.54)
- dayslost: number of days lost due to OAs in the private sector (.xlsx file theme 13 tab 13.1 “TOTAAL, Aantal verloren dagen”, see Figure 2.54)
- fgfiche: frequency degree “Frequentiegraad” from the “sectorfiche” (see Figure 2.55)
- egfiche: severity degree “Werkelijke ernstgraad” from the “sectorfiche” (see Figure 2.55)
- nacctplfiche: number of OAs (sum of t temporary, p permanent and l lethal, first three rows of “Aantal ongevallen per jaar” from the “sectorfiche” (see Figure 2.55)
- nacctplxlsx: number of OAs (.xlsx file theme 13 tab 13.1 “TOTAAL, Aantal ongevallen” + “TOTAAL, Aantal dodelijke ongevallen”, see Figure 2.54)
- naccdeltafichexlsx: difference between the number of OAs from the “sectorfiche” and the .xlsx file (nacctplfiche - nacctplxlsx)
- fgcalc: calculated frequency degree based on the number of OAs and the number of hours exposure from the .xlsx (nacctplxlsx / nhexprsz times 1000000)
- egcalc: calculated severity degree based on the number of days lost and the number of OAs from the .xlsx (dayslost / nhexprsz times 1000)
| year | nemployers | nfte | nhexpcalc | nhexprsz | dayslost | fgfiche | egfiche | nacctplfiche | nacctplxlsx | naccdeltafichexlsx | fgcalc | egcalc |
|---|---|---|---|---|---|---|---|---|---|---|---|---|
| 2014 | 244865 | 2299752 | 4002488381 | 4050362350 | 1767201 | 17.05 | 0.44 | 69047 | 69047 | 0 | 17.05 | 0.44 |
| 2015 | 242661 | 2314402 | 4027985241 | 4098999471 | 1726592 | 16.25 | 0.42 | 66585 | 66603 | -18 | 16.24 | 0.42 |
| 2016 | 245890 | 2359989 | 4107324856 | 4184307614 | 1855533 | 16.55 | 0.44 | 69242 | 69242 | 0 | 16.55 | 0.44 |
| 2017 | 250178 | 2413769 | 4200923568 | 4288528052 | 1826442 | 16.16 | 0.43 | 69316 | 69316 | 0 | 16.16 | 0.43 |
| 2018 | 249543 | 2441339 | 4248906396 | 4343011634 | 1895727 | 16.20 | 0.44 | 70338 | 70337 | 1 | 16.20 | 0.44 |
| 2019 | 251023 | 2514518 | 4376267127 | 4471621916 | 1842316 | 15.30 | 0.41 | 68288 | 68288 | 0 | 15.27 | 0.41 |
| 2020 | 253154 | 2485729 | 4326162752 | 4398525986 | 1579402 | 12.60 | 0.36 | 55609 | 55609 | 0 | 12.64 | 0.36 |
| 2021 | 258612 | 2465297 | 4290602899 | 4413693163 | 1745584 | 14.00 | 0.40 | 61862 | 61862 | 0 | 14.02 | 0.40 |
| 2022 | 261052 | 2587416 | 4503138806 | 4619020516 | 1705352 | 13.00 | 0.37 | 59862 | 59863 | -1 | 12.96 | 0.37 |
| 2023 | 278782 | 2579661 | 4489642004 | 4617669500 | 1707943 | 13.40 | 0.38 | 58835 | 58904 | -69 | 12.74 | 0.37 |
2.17.8 Determination of the total number of workers and full time equivalents (company level)
The number of workers (paid employees) per employer per year (n) is calculated by counting the number of unique individuals with a wage calculation per employer per year.
The number ofFTE workers was calculated in two ways. The first method is the method described in Section 1.1.3 as a first step to calculate the frequency and severity degrees. We divide the total number of hours worked by the employee (nominator) by the standard number of hours representing a full-time employee over the same period in the same function (denominator) and check the resulting proportion. When the result is over 0.75, a worker is considered to work 100% (1), in all other cases, a worker is considered to work 50% (0.5). The number of FTE workers (per employer) (fte1) is counted by making the sum of all rounded quotients.
The second method is the method in which the sum of quotients is made without any roundings.
The quantiles of the number of workers and full time equivalents (both methods) for all employers in the dataset (46501) is shown in Table 2.96. The first method yields a lower result for the number ofFTE workers than the second method.
| quantile | n | fte1 | fte2 |
|---|---|---|---|
| 99.9% | 425.6 | 299 | 336.7 |
| 99% | 88.0 | 71 | 76.3 |
| 90.0% | 20.0 | 16 | 17.7 |
| 80.0% | 11.0 | 9 | 9.2 |
| 75.0% | 9.0 | 7 | 7.2 |
| 95.0% | 33.0 | 27 | 29.1 |
| 50.0% | 4.0 | 3 | 3.0 |
| 25.0% | 2.0 | 1 | 1.0 |
| 20.0% | 1.0 | 1 | 1.0 |
| 10.0% | 1.0 | 0 | 0.8 |
| 5.0% | 1.0 | 0 | 0.5 |
| 1.0% | 1.0 | 0 | 0.2 |
| 0.1% | 1.0 | 0 | 0.1 |
2.17.9 Determination of the frequency degree (company level)
As defined on the FEDRIS website, the frequency degree is the proportion of the total number of OA (at the workplace) with death or a permanent disability or temporary disability of at least one day as a result, excluding the day of the accident, to the number of hours exposed to risks at the workplace, multiplied by 1,000,000 (to obtain a workable figure).
The number of hours exposed to risk at the workplace is calculated based on the number of working days per year, which is determined by the NSSO based on the quarterly DmfA of the employers and provided subsequently to FEDRIS to calculate the frequency degree.
Liantis PS customers can use available data from Liantis PS to complete their quarterly DmfA. The DmfA numbers however are aggregated per three months and include pregnancies, holidays, long term sickness,… This might result in an overestimation of the estimated number of hours worked by workers effectively at work, and thus to an overestimation of the risk exposure in terms of number of hours effectively worked and consequently an underestimation of the frequency degree calculated.
In the current project, the effective paid and worked hours per employer per month are available for mutual Liantis ESPP and PS customers (see Section 2.17.2).
Thus, it is possible for mutual Liantis ESPP and PS customers to calculate employer specific yearly frequency degrees as follows:
- use the cleaned notifications as a proxy: filter away commuting accidents to keep workplace accidents, count the notifications with temporary, permanent or lethal disabilities per employer and per year
- use the hours from the wage calculations as a proxy: aggregate all effective hours over all workers per employer per month, aggregate all months per employer per year
- divide the number of retained cases by aggregated hours and multiply by 1,000,000
We first calculate the monthly statistics for all mutual customers.
In a next step, we aggregate to yearly statistics per customer. As expected, this dataset contains 10 lines (years) per mutual customer, thus 10*47,820 or 478,200 lines in total. In Table 2.97, we show in which mutual customers (per year) frequency degrees can be calculated: if a total number of worked hours (WH) is not missing and not equal to zero.
| year | withOAwithWH | withOAzeroWH | zeroOAwithWH | zeroOAzeroWH | total |
|---|---|---|---|---|---|
| 2014 | 1736 | 445 | 16425 | 29214 | 47820 |
| 2015 | 1944 | 188 | 20614 | 25074 | 47820 |
| 2016 | 2032 | 218 | 21338 | 24232 | 47820 |
| 2017 | 2000 | 297 | 21919 | 23604 | 47820 |
| 2018 | 2093 | 295 | 22361 | 23071 | 47820 |
| 2019 | 1990 | 325 | 22839 | 22666 | 47820 |
| 2020 | 1857 | 248 | 23796 | 21919 | 47820 |
| 2021 | 2069 | 243 | 24026 | 21482 | 47820 |
| 2022 | 2112 | 266 | 24517 | 20925 | 47820 |
| 2023 | 2025 | 257 | 24106 | 21432 | 47820 |
In Table 2.98, the same result is shown in percentages.
| year | withOAwithWH | withOAzeroWH | zeroOAwithWH | zeroOAzeroWH | total |
|---|---|---|---|---|---|
| 2014 | 3.63 | 0.93 | 34.35 | 61.09 | 100 |
| 2015 | 4.07 | 0.39 | 43.11 | 52.43 | 100 |
| 2016 | 4.25 | 0.46 | 44.62 | 50.67 | 100 |
| 2017 | 4.18 | 0.62 | 45.84 | 49.36 | 100 |
| 2018 | 4.38 | 0.62 | 46.76 | 48.25 | 100 |
| 2019 | 4.16 | 0.68 | 47.76 | 47.40 | 100 |
| 2020 | 3.88 | 0.52 | 49.76 | 45.84 | 100 |
| 2021 | 4.33 | 0.51 | 50.24 | 44.92 | 100 |
| 2022 | 4.42 | 0.56 | 51.27 | 43.76 | 100 |
| 2023 | 4.23 | 0.54 | 50.41 | 44.82 | 100 |
In a final step, we aggregate per year over all customers. As an illustration we add in Figure 2.56 the frequency degrees calculated from the FEDRIS .xlsx files for the private sector 2014 - 2023 (see fgcalc from Table 2.95) to the Liantis calculated frequency degrees. The lines run fairly parallel although the systematic difference is clear.
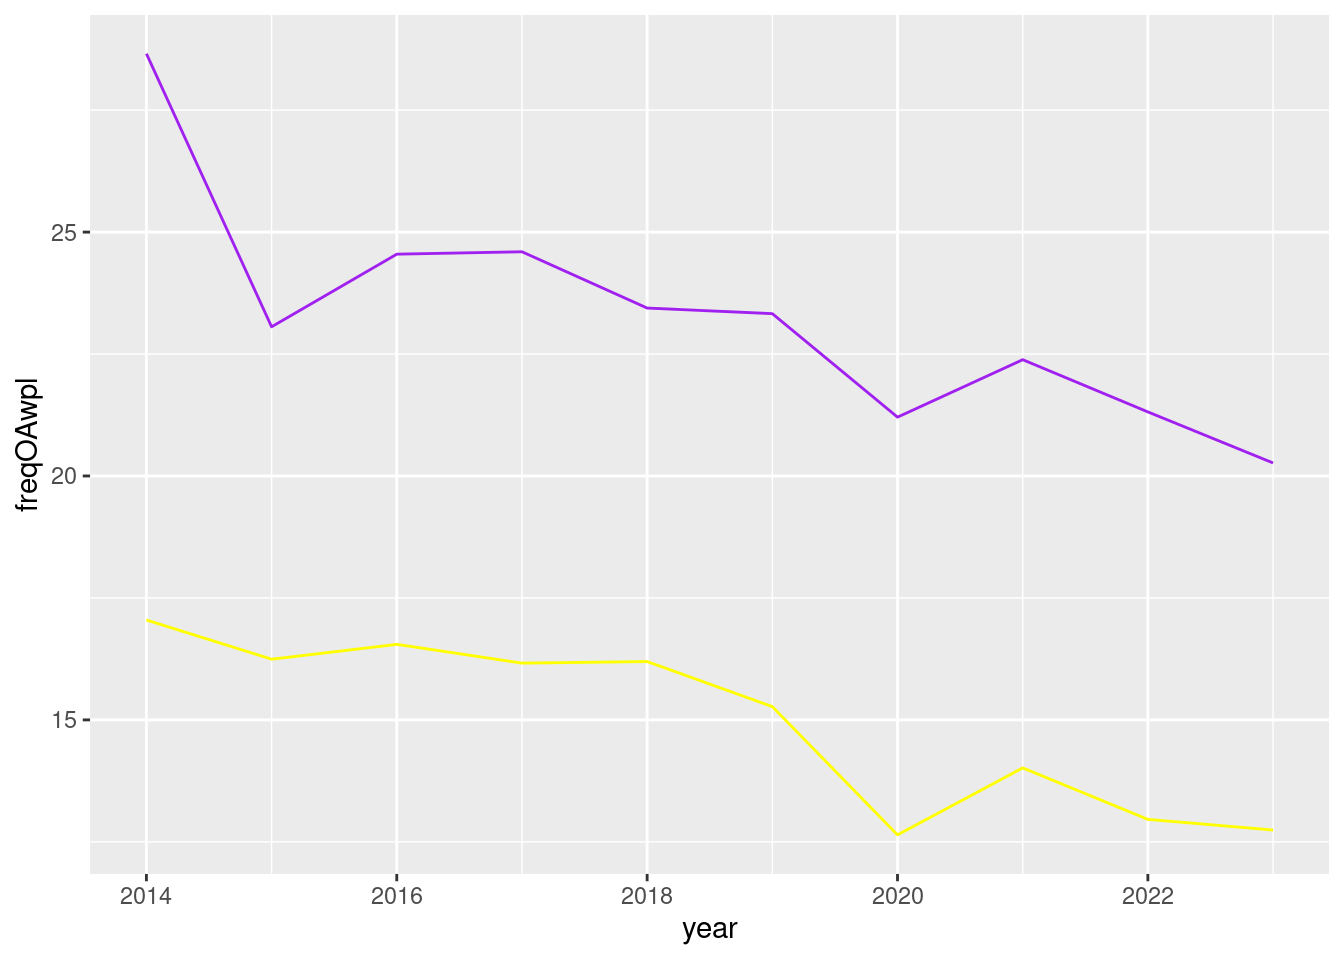
If we visualize the frequency degrees per employer per year using a boxplot (see Figure 2.57), we observe a highly skewed distribution. Applying a log10 transformation to the y-axis provides a more informative view: on the log scale, the variance appears stabilized, but remains substantial. This confirms that frequency degrees vary significantly across employers.
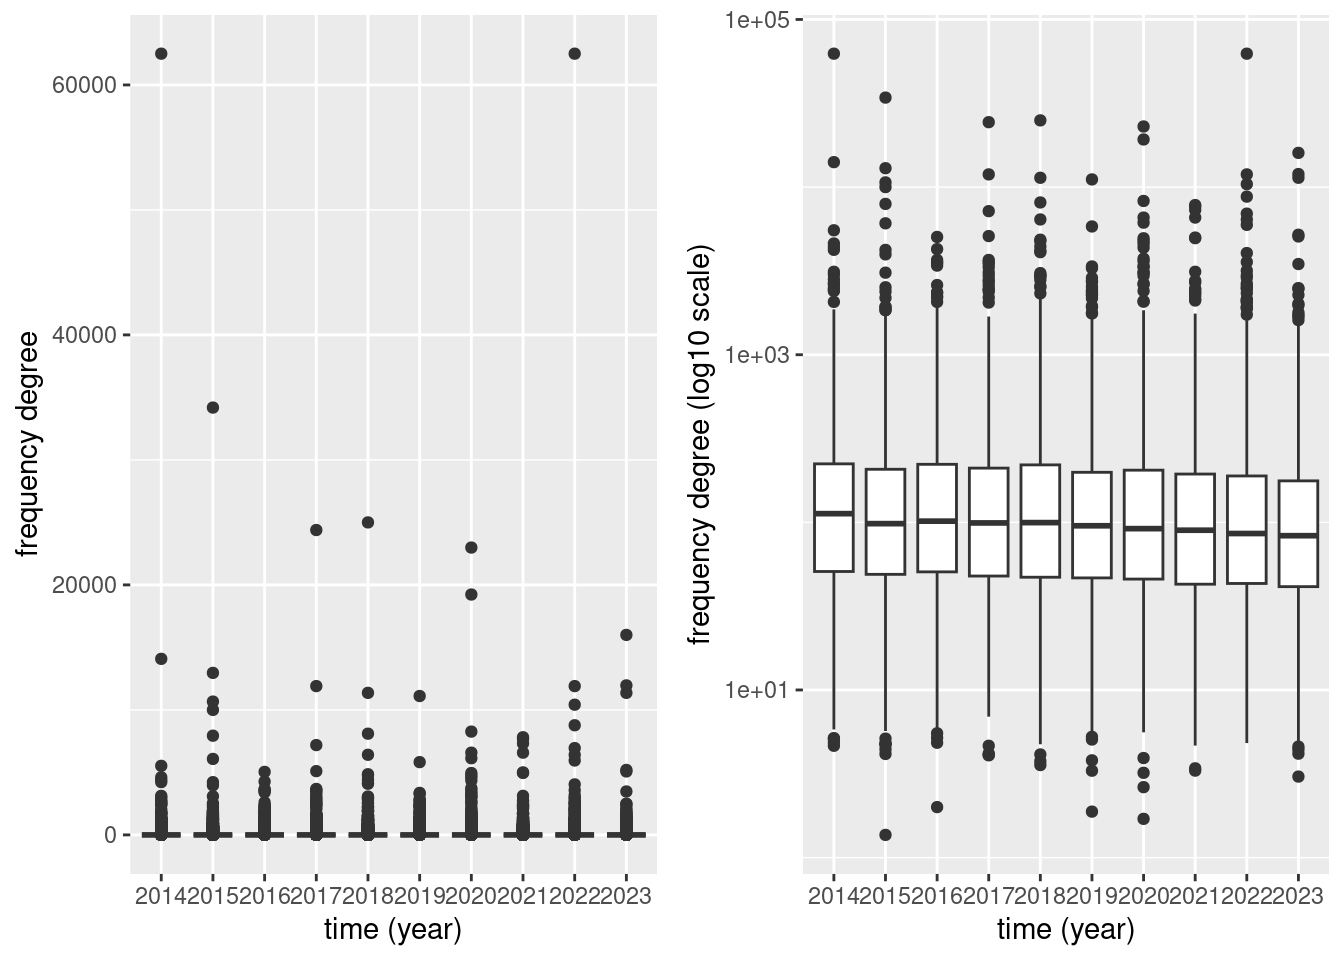
Data Quality Alert: yearly frequency degrees vary strongly across employers, the trend for all employers together resembles the published FEDRIS trend
- Liantis calculated frequency degrees are systematically different from FEDRIS frequency degrees, but since the lines run parallel, they might form a good starting point for further modelling (see Figure 2.56)
- yearly frequency degrees vary strongly across employers, which might complicate this further modelling (see Figure 2.57)
2.17.10 Determination of the severity degree (company level)
As defined on the FEDRIS website, the severity degree is ratio of the real number of lost calendar days due to OAs (at the workplace) to the number of hours exposed to risk, multiplied by 1,000 (to obtain a workable figure).
The number of lost calendar days is available for FEDRIS after final acceptance of the OA (predominantly via the insurers). For the number of hours exposed to risks at the workplace, FEDRIS receives DmfA hours from the NSSO (in Dutch Rijksdienst voor Sociale Zekerheid (RSZ)) as a proxy (see Section 2.17.9).
As described in the former paragraph, we have the effective paid and worked hours per employer per month available for mutual Liantis ESPP and PS customers for use in the current project (see Section 2.17.2).
The number of lost calendar days is not directly available from Liantis source data, but for the current project, we wrote a function to calculate it from the wage calculation source data. The idea behind the function is that sequences of combinations of wage codes related to OA (see Section 2.17.3) -not interrupted with codes linked to normal paid work activities- can be used from the daily calendar of a worker experiencing an OA.
Analysing all days for all workers is not possible. This would mean that we would have to examine 365*10 days for each single worker in the database (several hundred thousands of workers). The analysis of individual calenders however only needs to be carried out whenever an OA notification is present.
Thus, it is possible for mutual Liantis ESPP and PS customers to calculate employer specific yearly severity degrees as follows:
- record crbnr (unique employer id), insznr (unique employee id) and date of the OA for each notification, as well as the FEDRIS validated number of lost calendar days (nDaysTAO) (when available)
- define the start of the database calendar lookup as the first day of the month before the month of the accident
- define the end of the database calendar lookup as the last day of the month after the month of the accident date plus the FEDRIS validated number of lost calendar days (nDaysTAO available) or plus 365 days (nDaysTAO not available)
- fetch the daily calendars of all employer/employee combinations in all defined periods
- analyse the daily calendars to calculate the number of lost calendar days due to OA from the Liantis PS calendar per notification
- link each result to each notification and filter the notifications on workplace accidents with temporary, permanent or lethal incapacity and examine the quality of the calculated number of lost days versus the FEDRIS validated number of lost days
- if the quality is acceptable, Liantis specific severity degrees can be calculated
In a first step the question to lookup individual calender codes for the Liantis Data Application Support (DAS) team was constructed. An example of the first lines of the provided (pseudonymised) lookup question is shown in Table 2.99. The question was filed 2024-12-20.
| NR_FAO | crbnr | insznr | nDaysTAO | dateOA | range | dtfrom | dtto |
|---|---|---|---|---|---|---|---|
| faonr19 | crbnrexam1 | insznrexam1 | 0 | 2014-01-03 | 0 | 2013-12-01 | 2014-02-28 |
| faonr20 | crbnrexam2 | insznrexam2 | 6 | 2014-01-06 | 6 | 2013-12-01 | 2014-02-28 |
| faonr21 | crbnrexam3 | insznrexam3 | 0 | 2014-01-03 | 0 | 2013-12-01 | 2014-02-28 |
| faonr22 | crbnrexam4 | insznrexam4 | 55 | 2014-01-06 | 55 | 2013-12-01 | 2014-03-31 |
| faonr23 | crbnrexam5 | insznrexam5 | 4 | 2014-01-06 | 4 | 2013-12-01 | 2014-02-28 |
| faonr24 | crbnrexam6 | insznrexam6 | 3 | 2014-01-07 | 3 | 2013-12-01 | 2014-02-28 |
In total, we asked to look up 67590 individual calendar periods.
In a second step a script to fetch the data (in batch) was developed by colleagues of the Liantis DAS team. After testing and verification, the query was carried out seven times (batches of 10,000 notifications) and the seven output files were stored as .csv files. The answer with individual calendar data for presumed OA absences was available for further research from 2025-02-23 on.
In a third step, the raw .csv data files with calendar codes could be analysed to calculate absence periods linked to OA.
In a fourth step, after processing the seven .csv files, a single combined file with all periods could be produced.
In a fifth step, the combined file with periods could be used to fuzzy join the periods to the OA notifications.
In a final step, we can compare the calculated number of days of absence due to work accidents from the Liantis PS calendars with the validated number of days of absence due to work accidents as reported by FEDRIS through the insurers.
The conclusion is that in 27938 cases, as well a calculated number and validated number are available. The determination coefficient of a simple linear model using the calculation as a prediction for the validation is 82.0%, which is very high. This means that using data from Liantis PS calendars can have an added value in daily reporting.
In conclusion, we aggregate per year over all customers. As an illustration we add in Figure 2.58 the severity degrees calculated from the FEDRIS .xlsx files for the private sector 2014 - 2023 (see egcalc from Table 2.95) to the Liantis calculated severity degrees. The lines run fairly parallel although the systematic difference is clear.
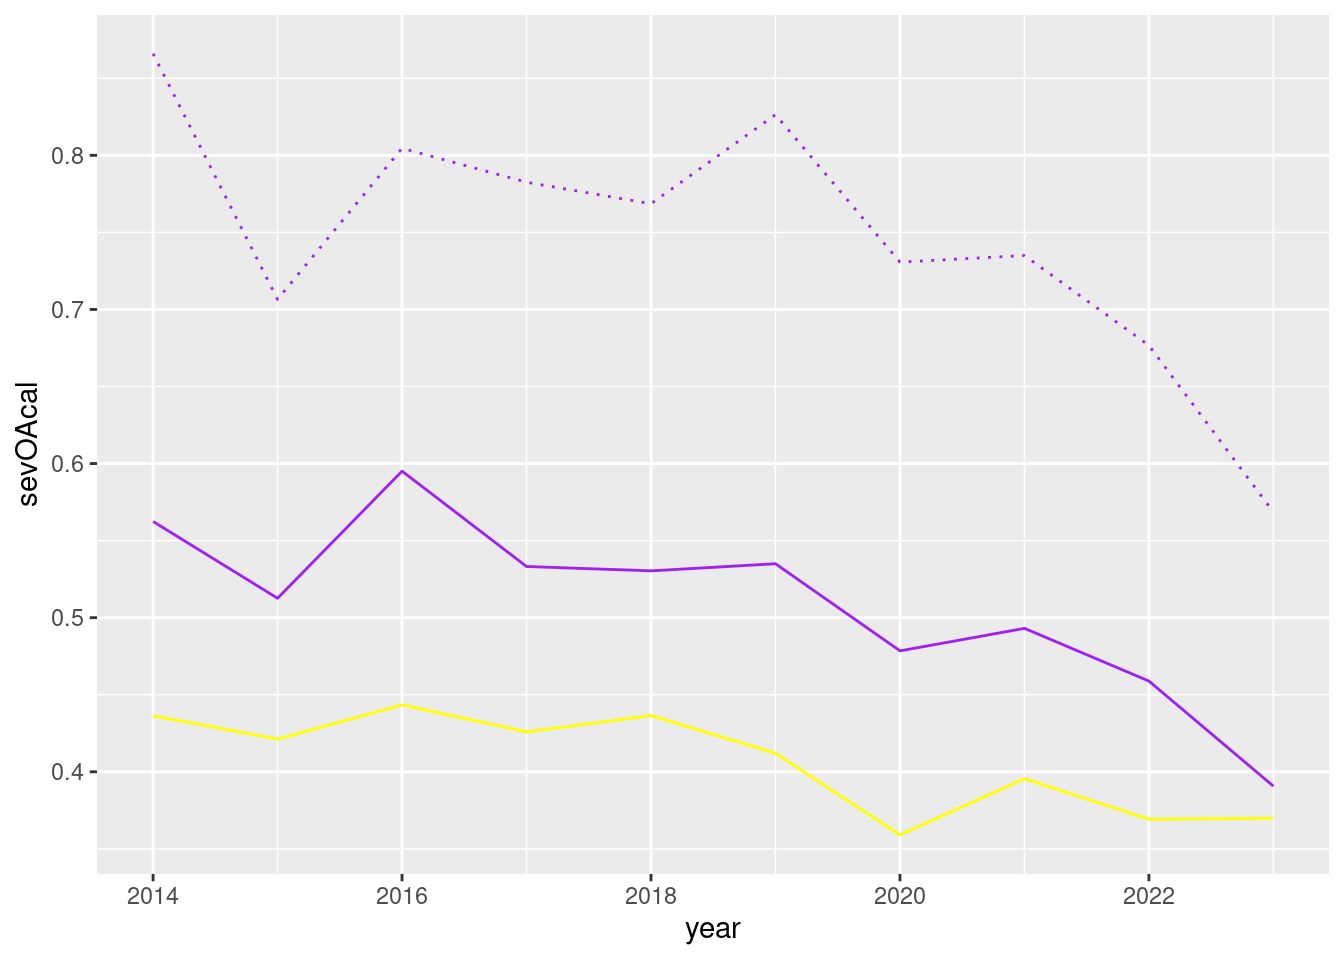
If we visualize the severity degrees per employer per year using a boxplot (see Figure 2.59), we observe a highly skewed distribution. Applying a log10 transformation to the y-axis provides a more informative view: on the log scale, the variance appears stabilized, but remains substantial. This confirms that severity degrees vary significantly across employers.
Data Quality Alert: yearly severity degrees vary strongly across employers, the trend for all employers together resembles the published FEDRIS trend
- Liantis calculated severity degrees are systematically different from FEDRIS severity degrees, but since the lines run parallel, they might form a good starting point for further modelling (see Figure 2.58)
- yearly severity degrees vary strongly across employers, which might complicate this further modelling (see Figure 2.59)
2.18 Data quality assessment of a selection of externally gathered calendar variables
Correcting for calendar events in daily time series is crucial because calendar events introduce systematic patterns and irregularities that can distort analysis, forecasting, and interpretation. Adjusting for calendar effects ensures that observed trends and seasonality reflect true underlying behaviours, not artefacts from e.g. holidays, weekends, or varying month lengths.
Since such structural calendar information is not available in the FEDRIS raw XML or Liantis processed data sources, we document in the next few paragraphs how Belgian holidays, school vacations, summer/wintertime changes, COVID-19 stringency measures, (extreme) weather data and other events were gathered and preprocessed.
2.18.1 Complete calendar with events by date (hollidays, vacations, summertime/wintertime)
First, we made an overview of fixed holidays. That is, holidays appearing each year on the same date, such as New Year’s Day and Christmas, and Labour Day. We categorized the fixed holidays into the classes legal, extra and general. The extra class representing regional holidays and general other days on which workers generally do not get a day off.
In Table 2.100, an overview is given.
| extra | general | legal | |
|---|---|---|---|
| Allerheiligen | 0 | 0 | 10 |
| Allerzielen | 10 | 0 | 0 |
| Dag van de arbeid | 0 | 0 | 10 |
| Driekoningen | 0 | 10 | 0 |
| Franse gemeenschap | 10 | 0 | 0 |
| Halloween | 0 | 10 | 0 |
| Kerstmis | 0 | 0 | 10 |
| Koningsdag/Duitse gemeenschap | 10 | 0 | 0 |
| Nationale feestdag van België | 0 | 0 | 10 |
| Nieuwjaar | 0 | 0 | 10 |
| Onze-Lieve-Vrouw-Hemelvaart/Moederdag Antwerpen | 0 | 0 | 10 |
| Oudejaar | 0 | 10 | 0 |
| Sinterklaas | 0 | 10 | 0 |
| Tweede kerstdag | 10 | 0 | 0 |
| Vaderdag Antwerpen | 0 | 10 | 0 |
| Valentijn | 0 | 10 | 0 |
| Vlaamse gemeenschap | 10 | 0 | 0 |
| Wapenstilstand/Sint-Maarten | 0 | 0 | 10 |
Second, we create a set of variable Christian holidays. These are holidays that do not occur on the same date each year, such as Easter and Ascension.
In Table 2.101, an overview is given.
| legal | |
|---|---|
| Onze-Lieve-Heer-Hemelvaart | 10 |
| Paasmaandag | 10 |
| Pasen | 10 |
| Pinksteren | 10 |
| Pinkstermaandag | 10 |
In a next step, vacations were added using the school holidays information from the Flemish government.
In Table 2.102, an overview is given.
| Var1 | Freq |
|---|---|
| Herfstvakantie | 90 |
| Kerstvakantie | 175 |
| Krokusvakantie | 84 |
| Paasvakantie | 172 |
| Zomervakantie | 744 |
Finally, we added summer and wintertime changes. We specifically labelled the week before and the week after both changes in march and october.
In Table 2.103, an overview is given.
| date | year | changetype | weektype | changeweektype |
|---|---|---|---|---|
| 2014-03-23 | 2014 | summer time change | week before | week before summer time change |
| 2014-03-24 | 2014 | summer time change | week before | week before summer time change |
| 2014-03-25 | 2014 | summer time change | week before | week before summer time change |
| 2014-03-26 | 2014 | summer time change | week before | week before summer time change |
| 2014-03-27 | 2014 | summer time change | week before | week before summer time change |
| 2014-03-28 | 2014 | summer time change | week before | week before summer time change |
| 2014-03-29 | 2014 | summer time change | week before | week before summer time change |
| 2014-03-30 | 2014 | summer time change | week before | week before summer time change |
| 2014-03-31 | 2014 | summer time change | week after | week after summer time change |
| 2014-04-01 | 2014 | summer time change | week after | week after summer time change |
| 2014-04-02 | 2014 | summer time change | week after | week after summer time change |
| 2014-04-03 | 2014 | summer time change | week after | week after summer time change |
| 2014-04-04 | 2014 | summer time change | week after | week after summer time change |
| 2014-04-05 | 2014 | summer time change | week after | week after summer time change |
| 2014-04-06 | 2014 | summer time change | week after | week after summer time change |
| 2014-10-19 | 2014 | winter time change | week before | week before winter time change |
| 2014-10-20 | 2014 | winter time change | week before | week before winter time change |
| 2014-10-21 | 2014 | winter time change | week before | week before winter time change |
| 2014-10-22 | 2014 | winter time change | week before | week before winter time change |
| 2014-10-23 | 2014 | winter time change | week before | week before winter time change |
| 2014-10-24 | 2014 | winter time change | week before | week before winter time change |
| 2014-10-25 | 2014 | winter time change | week before | week before winter time change |
| 2014-10-26 | 2014 | winter time change | week before | week before winter time change |
| 2014-10-27 | 2014 | winter time change | week after | week after winter time change |
| 2014-10-28 | 2014 | winter time change | week after | week after winter time change |
| 2014-10-29 | 2014 | winter time change | week after | week after winter time change |
| 2014-10-30 | 2014 | winter time change | week after | week after winter time change |
| 2014-10-31 | 2014 | winter time change | week after | week after winter time change |
| 2014-11-01 | 2014 | winter time change | week after | week after winter time change |
| 2014-11-02 | 2014 | winter time change | week after | week after winter time change |
As an example, a calendar plot of 2014 is shown in Figure 2.60.
2.18.2 COVID-19 stringency measures
In 2020, we experienced strong consequences of the COVID-19 pandemic. The Belgian government took several measures to limit the spread of the virus. We added these measures to our dataset, using the Oxford COVID-19 Government Response Tracker (OxCGRT). This tracker provides a daily record of government responses to the pandemic, including lockdowns, school closures, and other restrictions. More information can be found in the original publication of Hale et al. (2021). We specifically used the stringency index, which is a composite measure of the strictness of these measures.
The OxCGRT dataset was downloaded, filtered for CountryName==Belgium and transformed into a long format, where each row represents a specific date with a corresponding COVID-19 stringency index value. This will allows us to analyze the potential impact of these measures on OAs.
In Figure 2.61, we show the number of commuting and workplace accidents in relation to the COVID-19 stringency index. The effect of the first lockdown around March 16, 2020 is clearly visible in the data: the elevation of the stringency index coincides with a decrease in the number of commuting and workplace accidents.
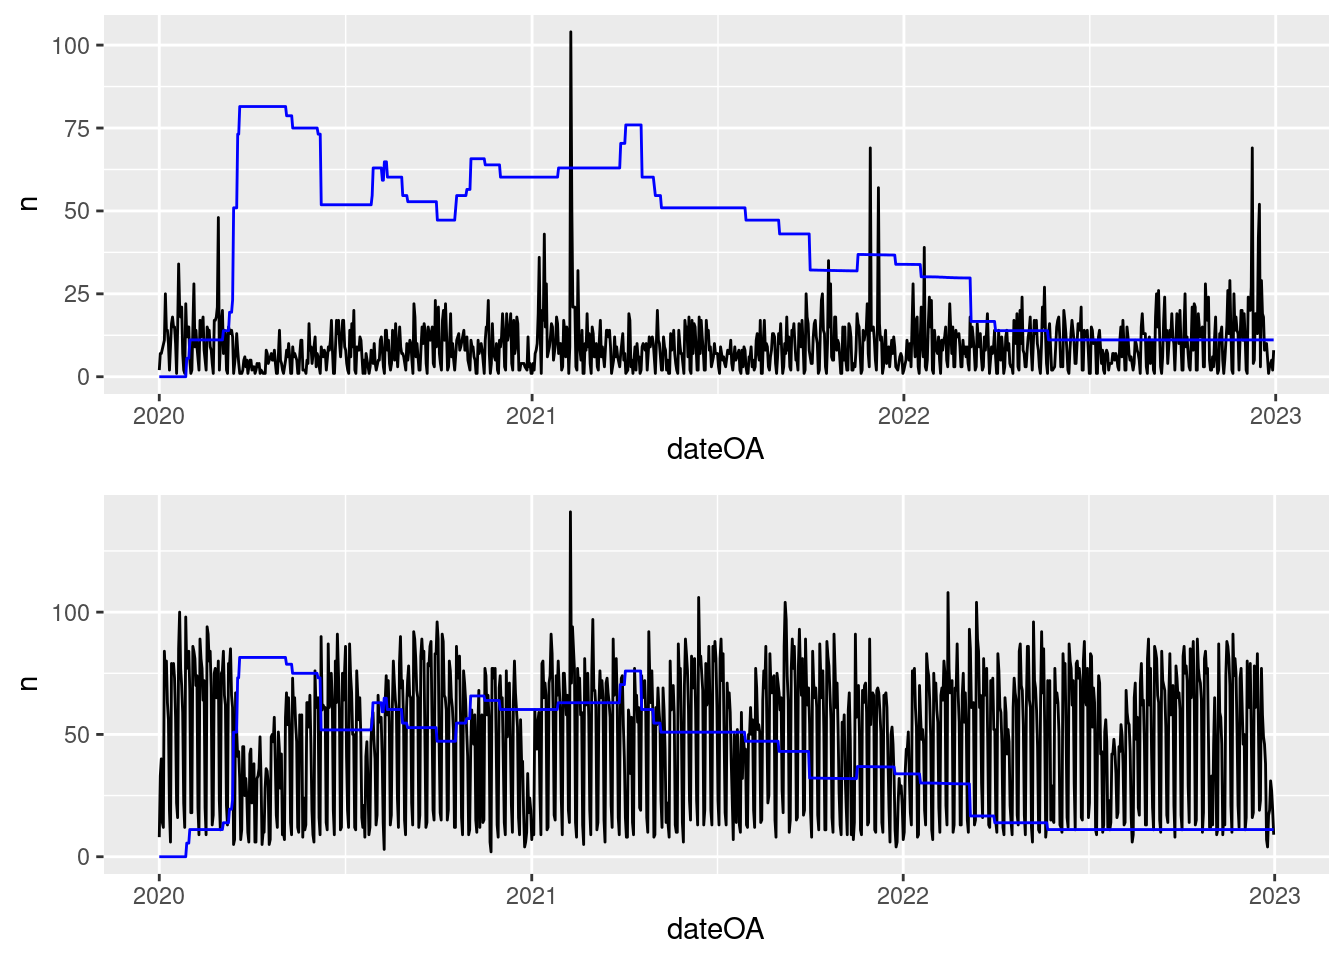
2.18.3 Weather data
Belgian weather data were collected from the Royal Meteorological Institute of Belgium (RMI) website. Herefore, we followed their guidelines and manual for accessing the open data platform. The collected datasets from 20 weather stations across Belgium (Ernage, Dourbes, Melle, Middelkerke, Sint-Katelijne-Waver, Bierset, Diepenbeek, Ukkel, Stabroek, Zeebrugge, Beitem, Sint-Hubert, Spa, Buzenol, Mont-Rigi, Humain, Retie, Deurne, Gossielies and Zaventem), cover a period from 2014 to 2023 and include daily weather observations for variables such as temperature, precipitation, and wind speed.
Wind speed directions (in degrees) were classified as factors based on the cardinal directions. The degrees were grouped into 16 categories, each representing a specific direction.
| rn | cardinal | degree_min | degree_max |
|---|---|---|---|
| 1 | N | 348.75 | 11.25 |
| 2 | NNE | 11.25 | 33.75 |
| 3 | NE | 33.75 | 56.25 |
| 4 | ENE | 56.25 | 78.75 |
| 5 | E | 78.75 | 101.25 |
| 6 | ESE | 101.25 | 123.75 |
| 7 | SE | 123.75 | 146.25 |
| 8 | SSE | 146.25 | 168.75 |
| 9 | S | 168.75 | 191.25 |
| 10 | SSW | 191.25 | 213.75 |
| 11 | SW | 213.75 | 236.25 |
| 12 | WSW | 236.25 | 258.75 |
| 13 | W | 258.75 | 281.25 |
| 14 | WNW | 281.25 | 303.75 |
| 15 | NW | 303.75 | 326.25 |
| 16 | NNW | 326.25 | 348.75 |
Weathertypes were recovered from the accompanying synoptic observations documentation of the RMI, in Dutch Koninklijk Meteorologisch Instituut van België (KMI).
| code | weathertype |
|---|---|
| 4 | zicht verminderd door rook, industriestof of vulkanische as |
| 18 | zware windstoot |
| 19 | water- of windhoos |
| 33 | zware stof- of zandstorm, is afgenomen in het afgelopen uur |
| 34 | zware stof- of zandstorm, zonder merkbare verandering in het afgelopen uur |
| 35 | zware stof- of zandstorm, is begonnen of toegenomen in het afgelopen uur |
| 37 | zware lage driftsneeuw |
| 39 | zware hoge driftsneeuw |
| 82 | wolkbreuk |
| 112 | weerlicht of bliksem op afstand |
The observed weathertypes were subsequently grouped intro snow, dust, fog, thunderstorm, haze, icing, icerain, heavy precipitation and precipitation conditions.
A mode function was used to summarize categorical data such as wind direction.
Three sets of daily summary measures were calculated:
- measurement summaries:
precip_q: total precipitation quantity for the day (mm)temp_med,temp_minandtemp_max: median, min and max temperature for the day (°C)wind_medandwind_max: median and max windspeed for the day (km/h)wind_dir: mode of the wind direction for the day (cardinal)pres_med: median atmospheric pressure for the day (hPa)sunshine_handcloudiness_h: sunshine and cloudiness duration for the day (hours)rh_med: median relative humidity for the day (%)
- observation summaries:
snow,dust,fog,thunderstorm,haze,icing,icerain,heavyprecipandprecip: total counts of these weather events during the day (0 = absent, >0 = present)
- binary variables:
temp_hot,temp_summerandtemp_tropical: max temperatures \(\geq\) 20, 25 and 30 °C respectivelytemp_cold,temp_winterandtemp_freezing: max temperatures <10 °C, min temperatures <0 °C and max temperatures <0 °C respectivelyrh_verylowandrh_veryhigh: relative humidities <30% and \(\geq\) 85% respectively
And in a last step, official Belgian heat waves were added.
A summary of the “bad” weather conditions present in the dataset -least to most occuring- is shown in Table 2.106.
| type | percabsent | percpresent | percNA |
|---|---|---|---|
| dust | 99.95 | 0.05 | 0.00 |
| thunderstorm | 98.86 | 1.14 | 0.00 |
| temp_freezing | 98.06 | 1.94 | 0.00 |
| temp_tropical | 98.05 | 1.95 | 0.00 |
| heatwave | 97.33 | 2.67 | 0.00 |
| heavyprecip | 96.89 | 3.11 | 0.00 |
| icerain | 96.16 | 3.84 | 0.00 |
| snow | 95.10 | 4.90 | 0.00 |
| fog | 94.08 | 5.92 | 0.00 |
| icing | 90.85 | 9.15 | 0.00 |
| temp_summer | 90.80 | 9.20 | 0.00 |
| haze | 90.12 | 9.88 | 0.00 |
| temp_winter | 89.60 | 10.40 | 0.00 |
| precip | 80.13 | 19.87 | 0.00 |
| temp_hot | 72.58 | 27.42 | 0.00 |
| temp_cold | 70.23 | 29.77 | 0.00 |
| rh_verylow | 59.67 | 0.10 | 40.23 |
| rh_veryhigh | 36.31 | 23.46 | 40.23 |
Data Quality Alert: only for relative humidity 40% of records are missing
- all measurements and observations could be summarized and categorised
- only for relative humidity 40% of records are missing; further exploration (data not shown) shows that all measurements were missing for Bierset, Deurne, Gosselies, Middelkere, Saint-Hubert, Spa and Zaventem and some measurements (often in 2016 and 2017) were missing for Beitem, Buzenol, Diepenbeek, Retie, Stabroek and Zeebrugge
Summary amount daily weather data records: >99% retrieved (0.7% is missing)
- total amount of possible daily weather data records: 20 stations, 10 years: 73040
- total amount of retrieved daily weather data records: 72532
- percentage retrieved daily weather data records: 99.3%
- hot and cold weather conditions are registered in ~30% of measurement days over all stations
- precipitation conditions are registered in ~20% of measurements days over all stations
- summer, winter and haze conditions are registered in ~10% of measurements days over all stations
- fog and snow are registered in ~5% of measurement days over all stations
Like with the holidays and vacations, we can also visualise these events using a calendar. In Figure 2.62 for example, days on which the RMI made snow observations across the 20 stations are marked in green. How darker the colour, how more snow observations were made.
In a next phase, the best available weather records on the day of the OA (minimum value of distance from the community of the OA to the communities of the 20 weather stations, summary per day) were added to the dataset with OAs. The same was done for the closest weather station to the place of work of employees not experiencing an OA (summary per month).
2.18.4 Put everything together on the calendar
As a last step, a full calendar with the number of (commuting and workplace) OA, events like holidays, vacations, time changes, COVID-19 stringency measures and weather observations was created. As an example, commuting and workplace OA by day are plotted in Figure 2.63 and Figure 2.64 respectively.
2.19 Representativeness and external benchmarking
2.19.1 Representativeness of the employer data
2.19.1.1 Belgian and Flemish employer data via NSSO
Detailed historical and actual quarterly data concerning the Belgian and Flemish workforce can be found on the website of the NSSO (in Dutch RSZ) here.
Reports are structured on four variables with different classifications.
The variables are:
- number of jobs or workposts,‘Employment_valPOSTES_NL_yyyyq.xlsx’
- number of employed workers,‘Employment_valTRAOCC_NL_yyyyq.xlsx’:
- work volume in full-time equivalents: ‘Employment_valVOLFTE_NL_yyyyq.xlsx’
- number of employers. ‘Employment_valAANTALW_NL_20141.xlsx’; sheet 1 total, sheet 2 private sector, sheet 3 public sector
The classification criteria are:
- statute (blue collar worker, white collar employee, civil servant)
- type of work (full-time, part-time,..)
- joint labour committee sector group
- age
- sex
- place of residence
- economical activity
- sector (private/public)
- employer dimension (<5, 5-9, 10-19, 20-49, 50-99, 100-199, 200-499, 500-999 and \(\geq\) 1000 employees)
- average daily wage
More details (in Dutch or French) can be found on the NSSO website under the global methodology section.
Two variables in these reports, the number of jobs and the number of employees, are actual counts realized on the last day of the quarter. In these counts, those who were present at work on the last working day of the quarter are counted, as well as those whose employment contract was not terminated but was suspended, due to illness or accident, pregnancy or maternity leave, or due to recall to military service, and those employees who were not present at work on the considered day due to leave, strike, partial or accidental unemployment, or justified or unjustified absence. Employees on full-time career break or full-time career break are not counted, but their possible replacements are.
The number of jobs on the last day of the quarter is obtained by counting the unique number of employees in service on the last day of the quarter per employer. Employees who are employed by more than one employer on the last day of the quarter are counted more than once. The difference between the number of jobs and the number of employees is entirely due to employees with multiple jobs across multiple employers. Employees who exercise different simultaneous jobs with the same employer (possibly under different capacities or under different contracts) are counted as 1 job. The characteristics of the main performance are retained. The determination of this is done analogously to the determination of the main performance for the calculation of the number of employees. This situation occurs predominantly in educational settings.
The number of employees is obtained by counting the unique number of employees in service on the last day of the quarter across employers. Multiple jobs are not taken into account. The characteristics of the main performance are retained. The check is performed on the basis of the unique identification number of the employee within the social security network (INSZ) and/or additional registers from the Crossroads Bank for Social Security, in Dutch abbreviated KSZ.
The work volume in full time equivalents is determined on the basis of all indicated paid work performances over the entire quarter, excluding purely fictitious performances (compensation and working days at the end of the employment contract). Therefore, no account is taken of the periods that are equated with working days for the granting of certain social rights and that often give rise to a replacement income. To maintain a certain uniformity, the vacation days of the blue collar workers are also taken into account (for the employees, vacation days are already included as paid days). The work performances of a worker who has been employed by several employers and/or under different capacities or in different working regimes during the quarter are all taken into account.
The number of employers is defined as the unique number of legal entities that, in the course of the quarter under consideration, had employees subjected to the national social security in paid service. This concept includes both legal entities and natural persons who, with regard to the law, have the status of employer in the NSSO counts.
The total number of employers in Belgium as defined by the NSSO per quarter is shown in Figure 2.65 below.
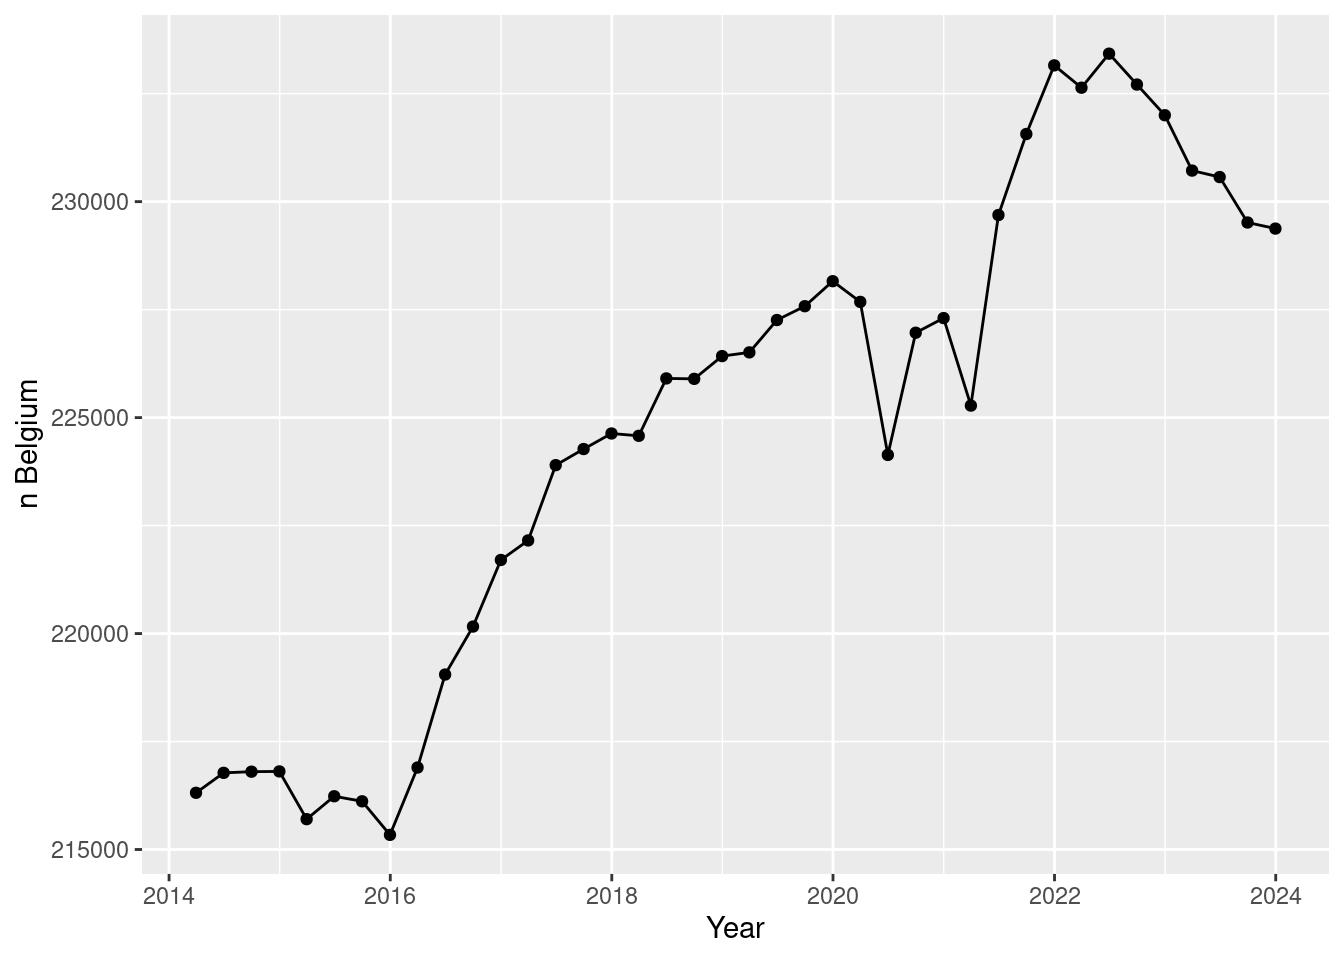
2.19.1.2 Belgian and Flemish employers by region and province (and NACE-BEL 2008) via NSSO
The NSSO (in Dutch RSZ) provides detailed data on the numbers of employers in the private sector per NACE-BEL 2008 level 1 sector in combination with the size of the company, but unfortunately not for NACE-BEL 2008 level 1 sector in combination with the location of the company. An inquiry was sent 28/03/2025 to the NSSO stats team to obtain this data. The data were received 10/04/2025.
The total number of employers in Belgium as defined by the NSSO per quarter per Region is shown in Figure 2.66 below.
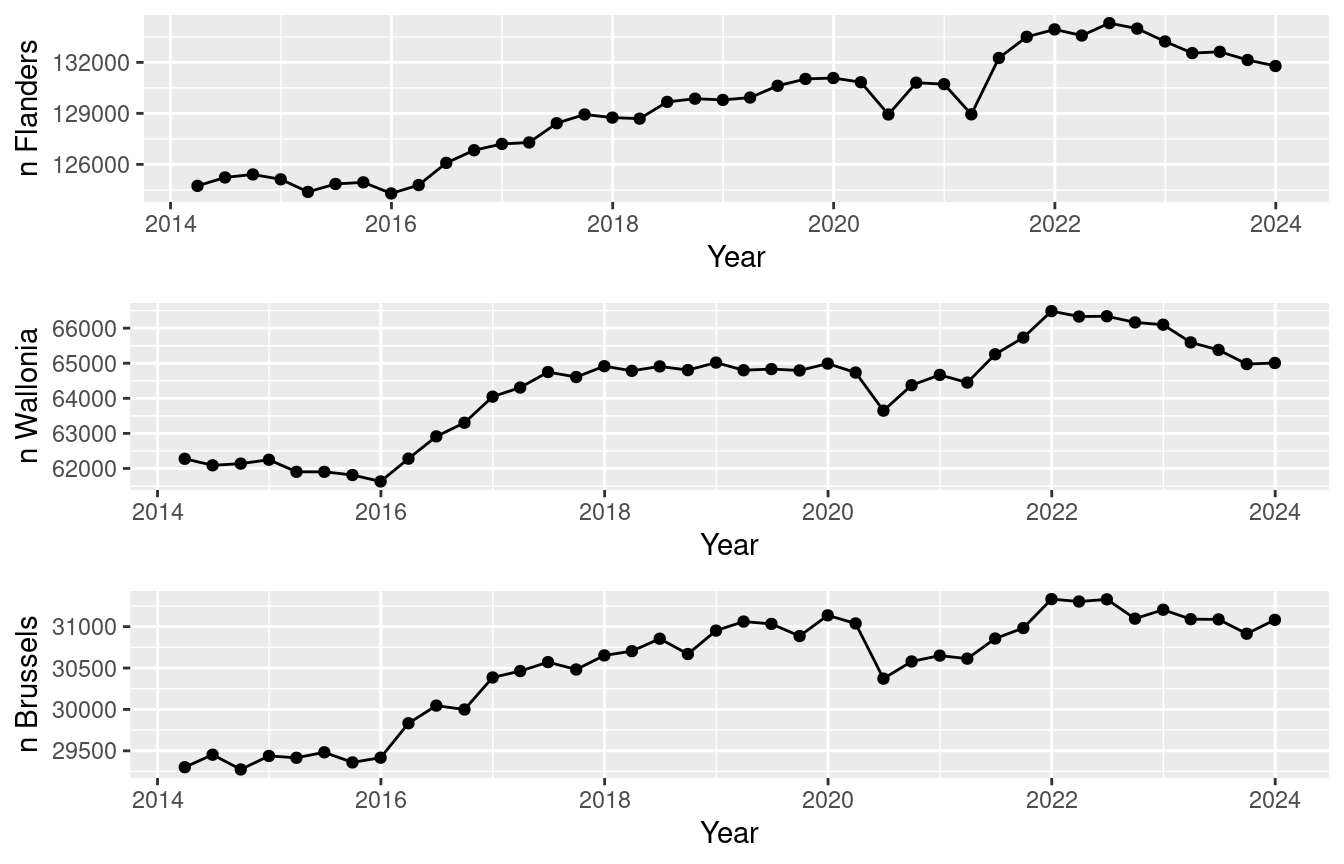
The total number of employers in Belgium as defined by the NSSO per quarter per Flemish province is shown in Figure 2.67 below.
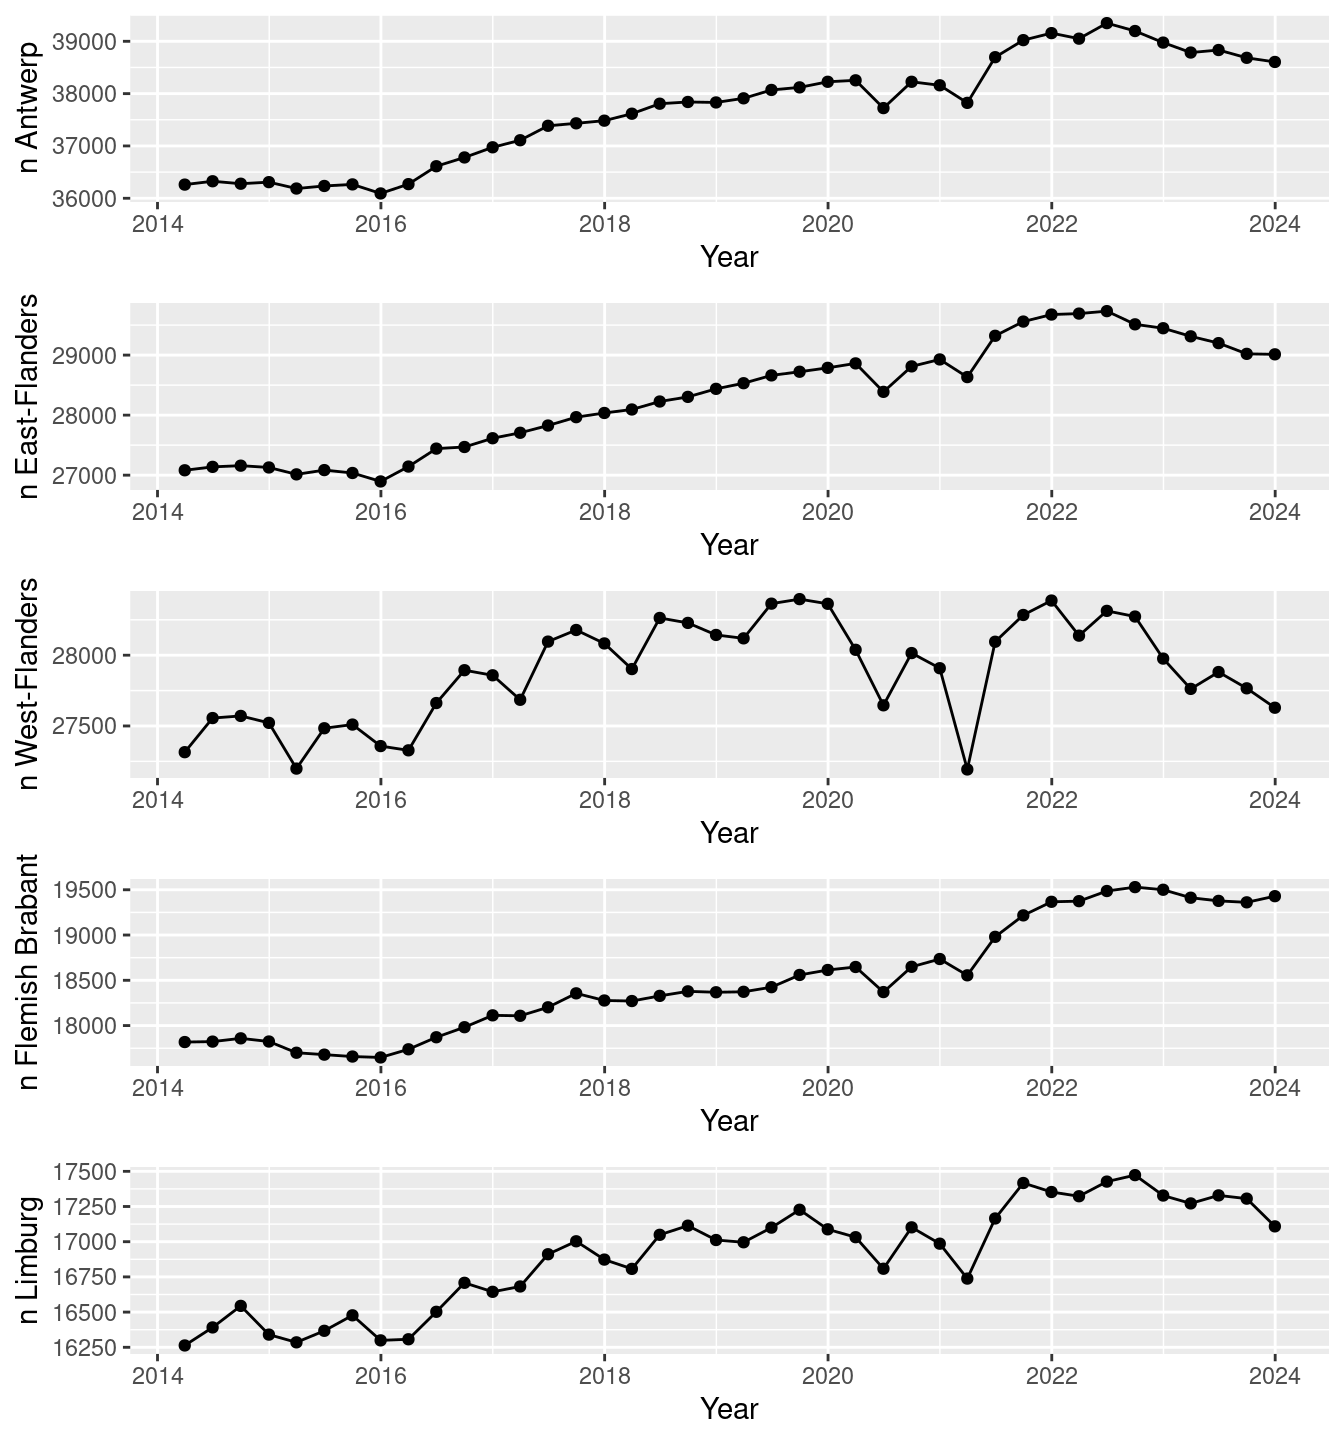
2.19.2 Representativeness of the employee data
2.19.2.1 Belgian and Flemish worker data via NSSO
Detailed historical and actual quarterly data concerning the Belgian and Flemish workforce can be found on the NSSO (in Dutch RSZ) website archives.
The total number of employees in Belgium as defined by the NSSO per quarter is shown in Figure 2.68 below.
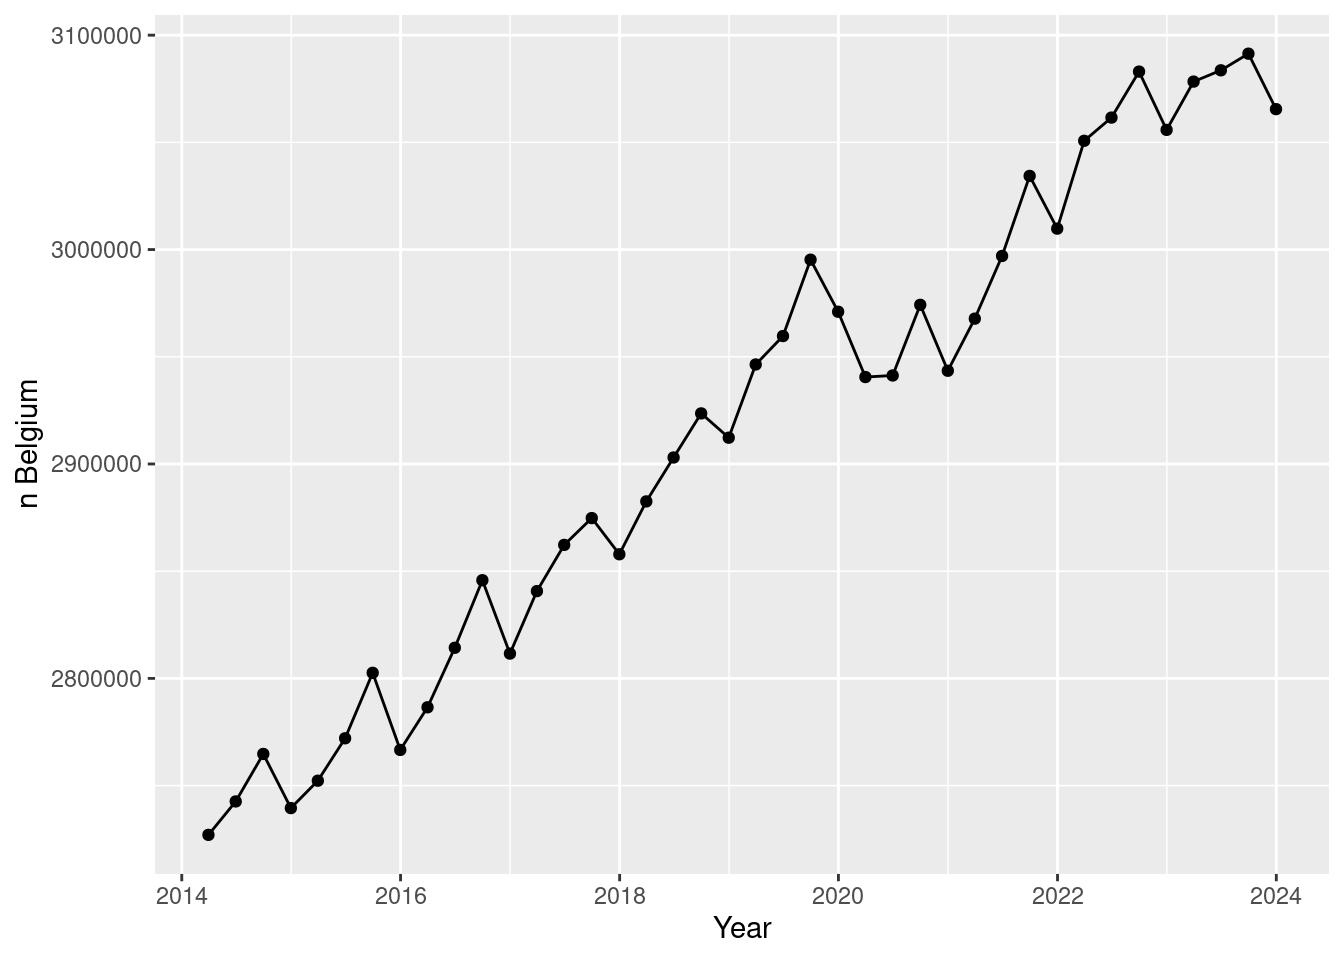
The total number of employees in Belgium as defined by the NSSO per quarter per Region is shown in Figure 2.69 below.
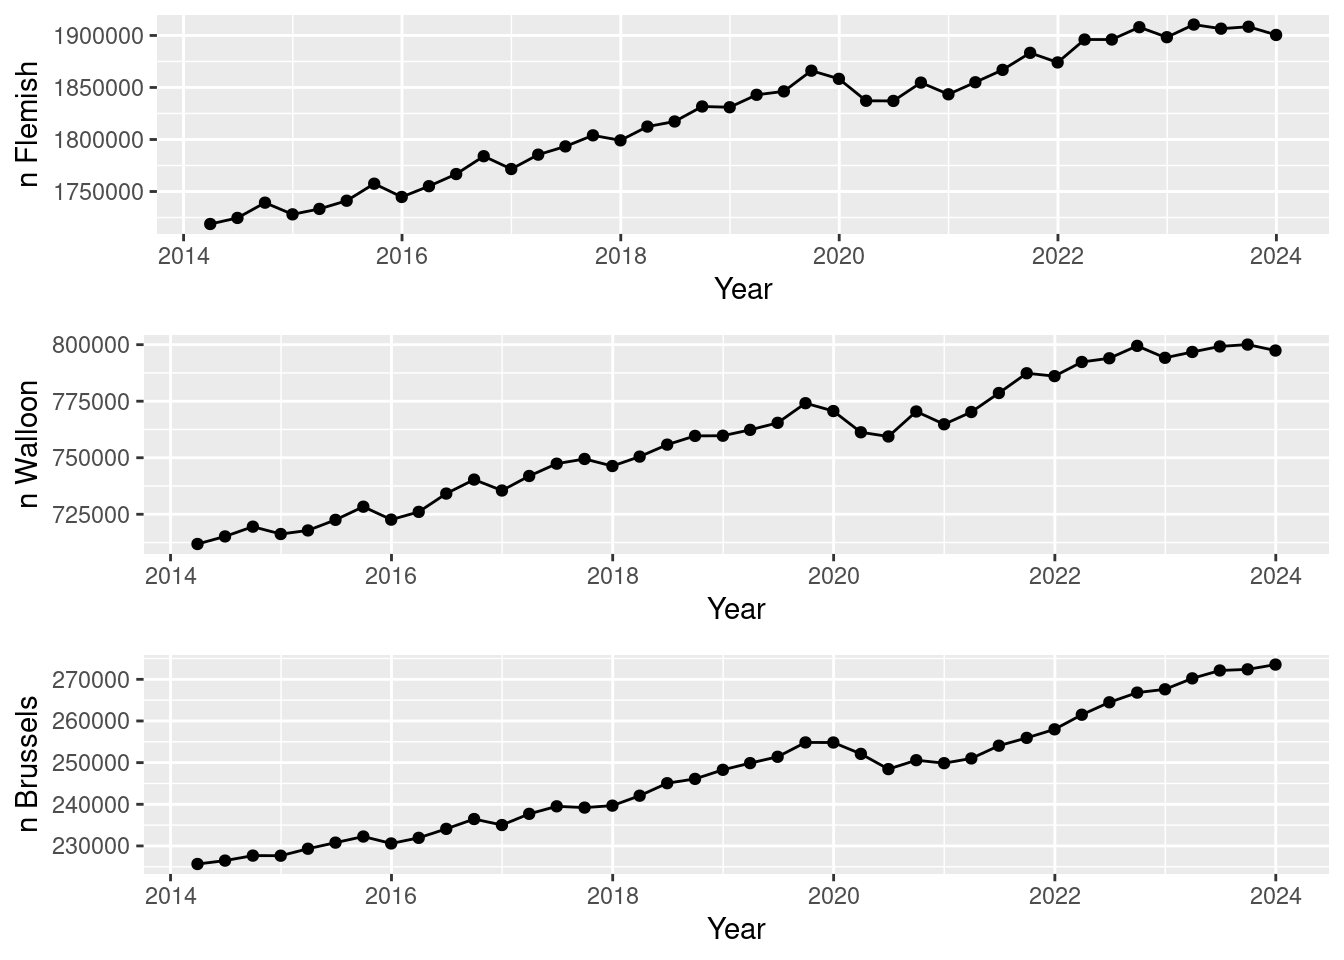
The total number of FTE in Belgium as defined by the NSSO per quarter is shown in Figure 2.70 below.
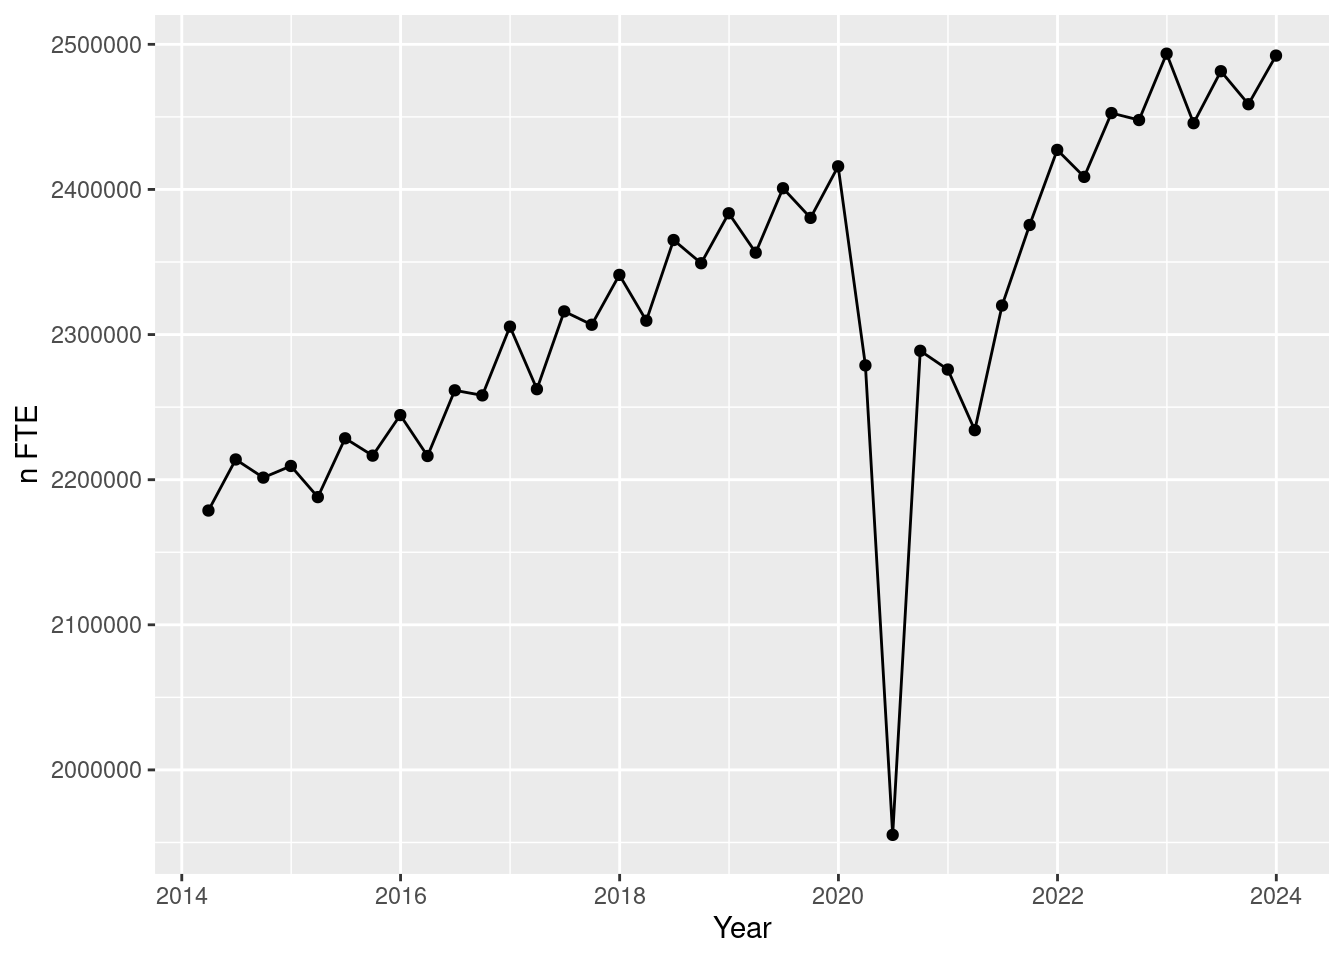
2.20 Conclusions about the additionally gathered datasets
In the previous sections, we described how several additional datasets were collected to enable in-depth analyses of the determinants of OA, using validated OA notification records as a proxy (see Section 2.10). Below, we briefly summarize the supplementary datasets that were gathered.
- Liantis ESPP data (for 69k customers)
- identified risk factors (per person per month, 2014-2023, see Section 2.11)
- time invested in prevention (per employer per month, 2014-2023, see Section 2.12)
- health complaints (for example hearing loss per person 2014-2023, see Section 2.13) and satisfaction, substance and alcohol use (per person over last 12 months, 2022-2023, see Section 2.14)
- PPE evaluations (per person per month, 2014-2023, see Section 2.15)
- Liantis PS data (for 48k mutual customers)
- number of people at work (see Section 2.17.1)
- signalitic data (date of birth, biological sex, nationality, language, residential location) (per person per month, 2014-2023, see Section 2.16 )
- effective labour hours (lost) and effective wage (lost) (absence & direct cost) (per person per month, 2014-2023, see Section 2.17.2, Section 2.17.3, Section 2.17.4, Section 2.17.5 )
- other determinants (blue/white collar, employment quotient, work location) (per employer per month, 2014-2023, see Section 2.17.6)
- Liantis RS data (for 12k mututal customers, data not shown)
- occupational accident insurer (per employer per month, 2016-2023)
- paid premiums (per employer per month, 2016-2023)
- General time-level determinants
- holidays, vacations and summer/wintertime changes (see Section 2.18.1)
- Corona stringency measures (per day 2000-2022, see Section 2.18.2)
- (extreme) weather data (per day 2014-2023, see Section 2.18.3)
- other events (terrorist attacks as an example, per day 2014-2023, see Section 3.4.5.9)
- External datasets to assess representativeness of employer and employee numbers across potential determinants (see Section 2.19)
Building a multifaceted dataset to uncover determinants of occupational accidents
In the second part of the data quality report, we brought together a wide range of data sources. We collected detailed information about workers -including health complaints, risk factors, use of protective equipment, working hours, absences, and wages- as well as employer-level data. In addition, we enriched the dataset with external factors such as weather conditions, public holidays, and COVID-19 restrictions, resulting in a unique comprehensive and multifaceted dataset.
With these additional datasets, alongside the validated occupational accident notifications, we are now fully equipped to begin the analytical phase and explore the underlying patterns and determinants of occupational accidents in depth.
List Of Acronyms
- ASR
- aangifte sociale risico’s
- CBE
- Crossroads Bank for Enterprises (KBO in Dutch)
- CBSS
- Crossroads Bank for Social Security (KSZ in Dutch)
- COVID-19
- Coronavirus Disease 2019
- DAS
- Data Application Support
- DmfA
- Déclaration multifonctionelle / multifunctionele Aangifte
- ESAW
- European Statistics on Accidents at Work
- ESPP
- External Service for Prevention and Protection at work (EDPB in Dutch)
- ETL
- Extraction, Transformation and Loading
- FAO
- Fonds voor Arbeidsongevallen (old Dutch name of FEDRIS before the fusion with FBZ, FAT in French)
- FARAO
- Federaal Actieplan voor de Reductie van Arbeidsongevallen
- FBZ
- Fonds voor Beroepsziekten (old Dutch name of FEDRIS before the fusion with FAO, FMP in French)
- FEDRIS
- Federaal agentschap voor beroepsrisico’s
- FTE
- Full Time Equivalent (VTE in Dutch)
- GIS
- Geographic Information System
- GMQ
- General Medical Questionnaire (AMV in Dutch)
- HR
- Human Resources
- INSZ
- Identificatienummer Sociale Zekerheid (rijksregisternummer of BIS-registernummer)
- ISCO
- International Standard Classification of Occupations
- KMI
- Koninklijk Meteorologisch Instituut van België
- KSZ
- Kruispuntbank Sociale Zekerheid (CBSS in English)
- LI
- Labour Inspectorate
- NACE
- Nomenclature générale des Activités économiques dans les Communautés Européennes of Europese activiteitennomenclatuur
- NACE-BEL
- Belgian version of the the Europese activiteitennomenclatuur (NACE)
- NIS
- Nationaal Instituut voor de Statistiek
- NSSO
- National Social Security Office
- OA
- Occupational Accident
- OAF
- Occupational Accident File (with FEDRIS specific accident number faonr or NRACCF)
- PPE
- Personal Protective Equipment
- PS
- Payroll Services
- RMI
- Royal Meteorological Institute of Belgium
- RS
- Risk Solutions
- RSZ
- Rijksdienst voor Sociale Zekerheid
- SFTP
- Secure File Transfer Protocol
- TAO
- Tijdelijke (volledige) Arbeidsongeschiktheid
- XML
- Extensible Markup Language
- XSD
- XML Scheme Defenition
- crbnr
- enterprise identification number within CBE
- faonr
- Fedris OAF number (also NRACCF)
- insznr
- personal identification number within NSSO (INSZ number)